Table of contents:
B. Study findings related to the second hypothesis
- The study showed that there were statistically significant differences at &=0.01 significance level between the experimental and control groups' independence skills averages in the post-assessment, i.e. after applying the functional curriculum in teaching the experimental group.
- The study showed that there were statistically significant differences at a 0.01 significance level, between the average independence skills scores of the experimental group that was taught the functional curriculum, and those of the control group after isolating the effect of the experimental group's pre-assessment scores. Therefore, the proposed functional curriculum is effective in helping students with moderate intellectual disabilities acquire functional skills.
- The results of the associated variance analysis revealed that there were statistically significant differences at a 0.01 significance level, between the experimental group and the control group in favour of the former, in strands 1, 2, 3, 4, 6, 7 and 8, after isolating the effect of the associated variable (experimental group pre-assessment scores).
- The study showed that there were no statistically significant differences at a 0.05 significance level between the experimental group and the control group in the post-assessment score in the security and safety strand, even after teaching the former the functional curriculum.
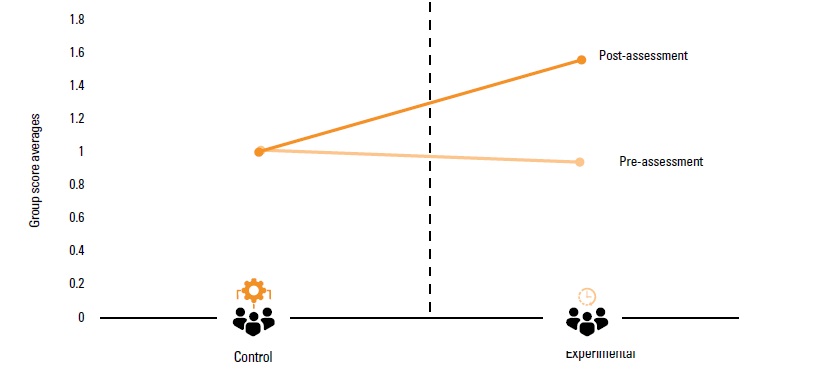
Figure 10. Averages of control and experimental group members in post-assessment
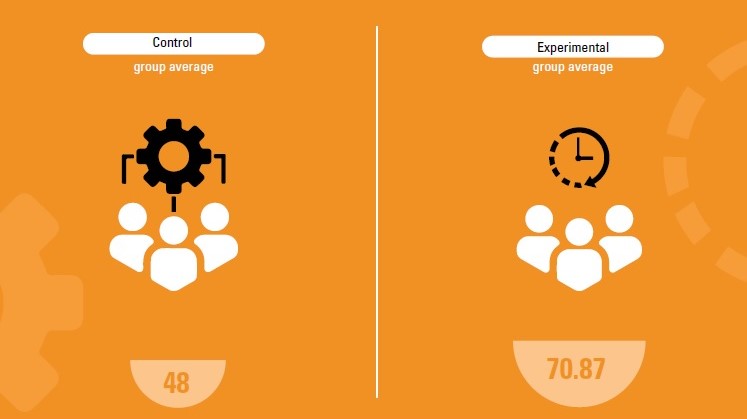
Source: Author.
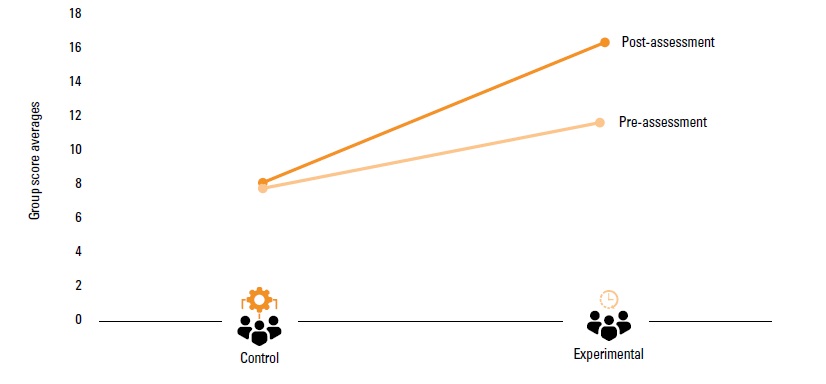
Figure 11. Differences between the calculated averages of the experimental and control groups in the pre- and post-assessment in the self-care strand
Source: Author.
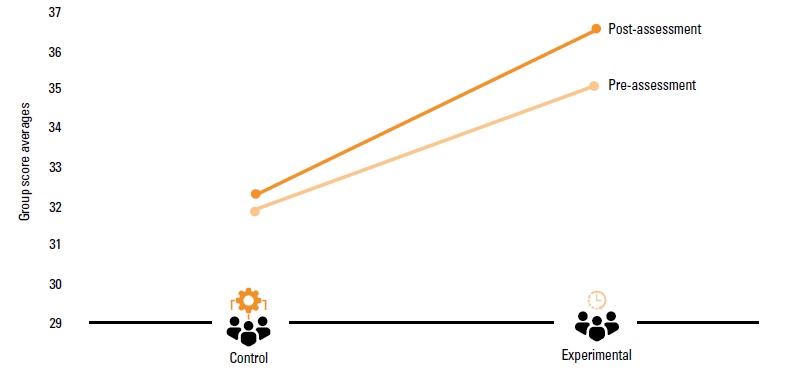
Figure 12. Differences between the calculated averages of the experimental and control groups in the pre- and post-assessment in the domestic skills strand

Figure 13. Differences between the calculated averages of the experimental and control groups in the pre- and post-assessment in the first-aid strand
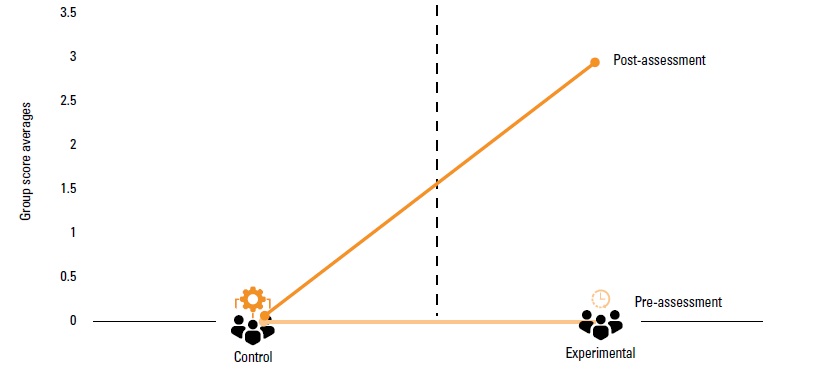
Source: Author.
Figure 14. Differences between the calculated averages of the experimental and control groups in the pre- and post-assessment in the telephone use strand
Source: Author.
Figure 15. Differences between the calculated averages of the experimental and control groups in the pre- and post-assessment in the security and safety strand
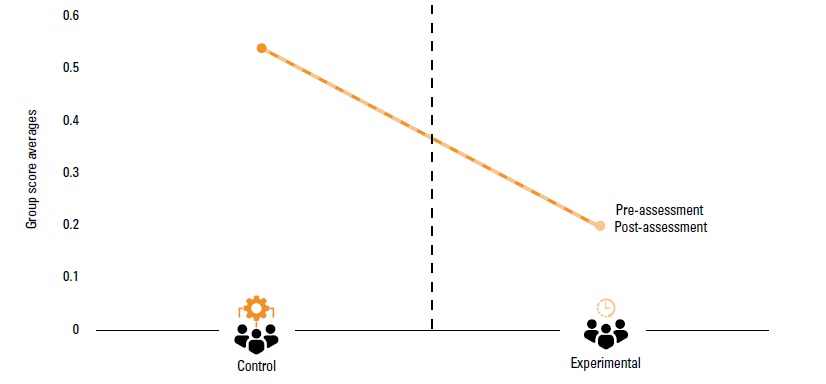
Source: Author.
Figure 16. Differences between the calculated averages of the experimental and control groups in the pre- and post-assessment in the shopping strand