جدول المحتويات:
Main findings
Sub-Saharan Africa is the most challenged region as was the case two decades ago (figure 9). Despite some progress, deprivations are acute, resulting from many factors, including poor governance, civil wars and shocks such as the AIDS pandemic.[1] Another region witnessing a high level of challenges is South Asia yet it also shows the greatest decline in challenges from 2000 to 2020. The least challenged region, North America, is the only region that witnessed an increase in its quality-adjusted human development challenge index in 2020 compared with 2010, after an improvement between 2000 and 2010.
Figure 9. Quality-adjusted human development challenge index regional scores and dimension shares, 2000, 2010 and 2020
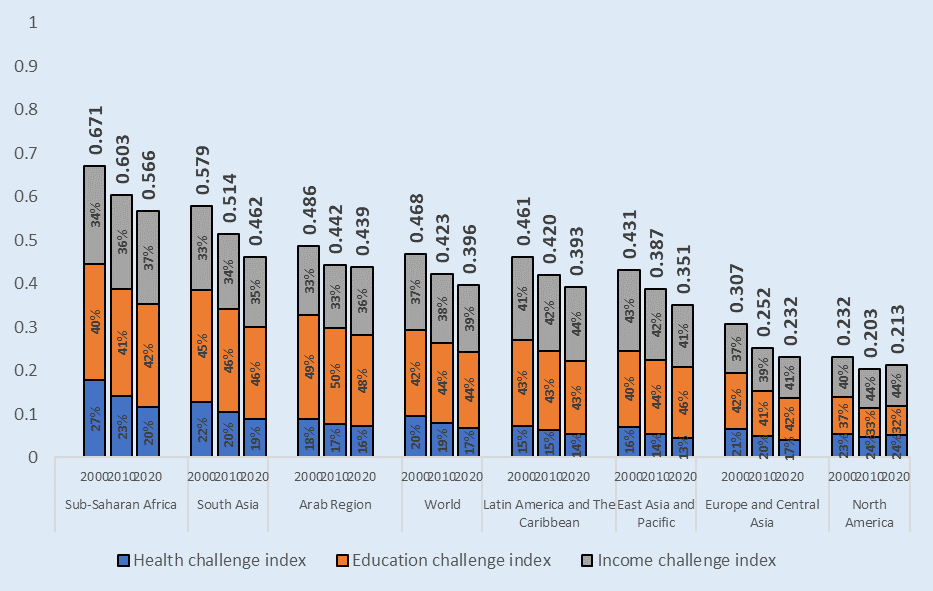
Source: ESCWA calculations.
For all regions, except Latin America and the Caribbean and North America, the largest share of the quality-adjusted human development challenge index comes from the education dimension (figure 9). The largest share in North America and Latin America and the Caribbean comes from the income component. This was also the case for North America since 2000, but this region’s quality-adjusted human development challenge is very low; all its dimension scores are below 0.3. For Latin America and the Caribbean, the education component had the largest share in 2000 and 2010. A change to the income dimension having the largest share is not surprising given the upward trend in many educational indicators in the region over the past 15 years.[2] Yet future data might show different trends, especially after the COVID-19 pandemic caused an unprecedented education crisis.[3]
The Arab region is particularly challenged in education, with shares of 48 per cent in 2020, 50 per cent in 2010 and 49 per cent in 2000 in the overall quality-adjusted human development challenge index. This is not surprising given the well-documented and very high inequality in education between and within Arab countries.[4] It is crucial to address gaps in education, which is often referred to as the great equalizer, given myriad effects on other challenges and especially in view of the Fourth Industrial Revolution.
In terms of global population shares at each level of the quality-adjusted human development challenge index, the highest share in 2020 was in the medium-challenge category (figure 10). This is an important improvement from 2000, when the highest share was in the very high-challenge category. The change is mainly due to improved scores of some highly populated countries in South Asia, however, such as Bangladesh and India, which moved from the very high-to the high-challenge category between 2000 and 2010. Pakistan made this move between 2010 and 2020. Another reason for global improvement is progress in some countries in East Asia and the Pacific, such as Indonesia, which moved from the high-to the medium-challenge category between 2000 and 2010. Most people still living in very high-challenge countries are in sub-Saharan Africa. Some progress has been made in countries with low challenges. France, Germany, the Republic of Korea and Singapore moved from the low-to the very low-challenge category between 2000 and 2010.
Figure 10. Population in each quality-adjusted human development challenge index category by region, 2000, 2010 and 2020
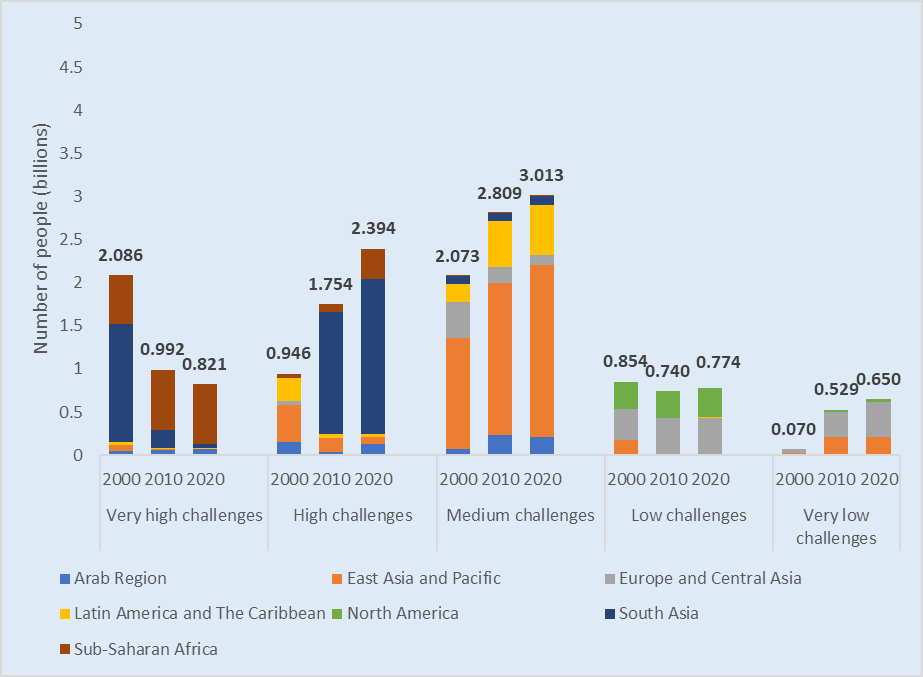
Source: ESCWA calculations.
Nine of the 10 most challenged countries are in sub-Saharan Africa (figure 11). While several reasons explain this poor performance, the fact that almost all of the most challenged countries are in this region underlines the need for major improvements in basic dimensions of development. Other regions, having notably reduced basic development concerns, should focus on tackling environmental and governance challenges.
Some subregional variations are evident. For instance, the tenth country in the most challenged group, Haiti, is in Latin America and the Caribbean, where the regional challenge level is lower than the global average. While North America is the least challenged region, the 10 least-challenged countries are all from Europe and Central Asia; five are Nordic countries. These variations could be attributed to several country-specific reasons. In Haiti, political instability and multiple shocks to the economy have led to high and increasing poverty rates and very high inequality. Health and education outcomes are poor. The World Bank expects a child born today in Haiti to be only 45 per cent as productive as they could be with a full education and health care.[5]
Figure 11. Least (green) and most (red) challenged countries globally on the quality-adjusted human development challenge index
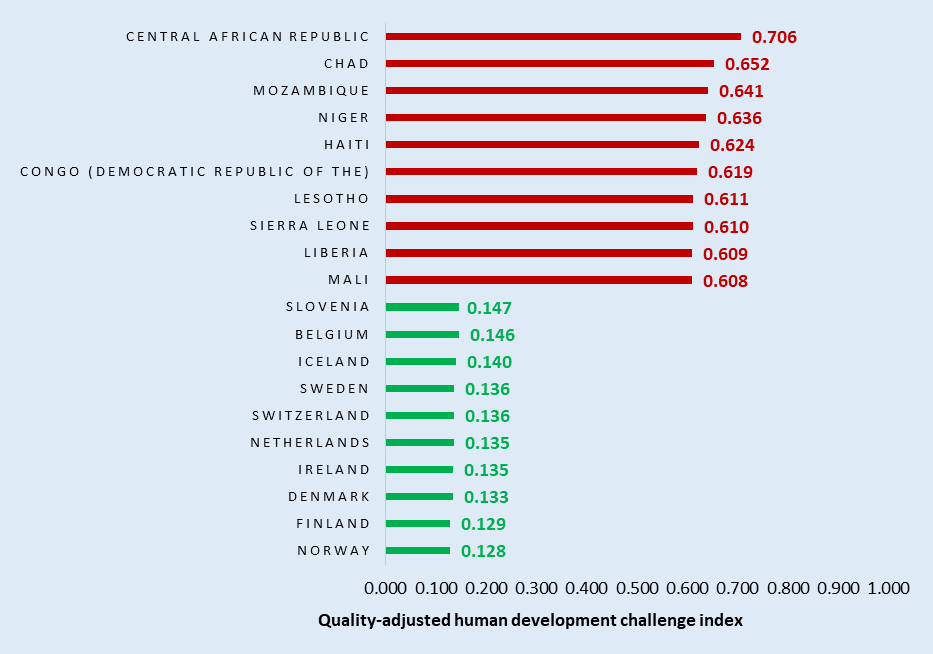
Source: ESCWA calculations.
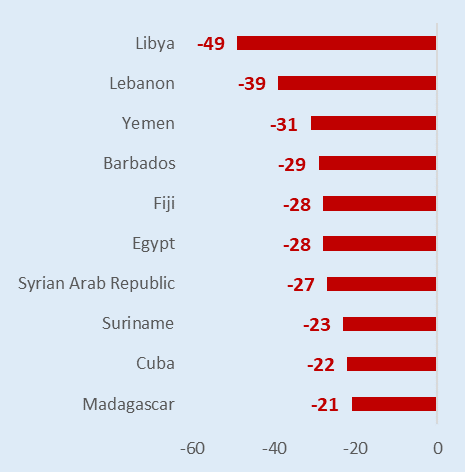
Over 2000-2020, many countries witnessed an increase in quality-adjusted human development challenge index scores. This occurred for different reasons, although conflict was among the main drivers. Three of the 10 countries with the highest deterioration in ranking on the index are conflict-affected Arab States, Libya, Yemen and the Syrian Arab Republic, respectively (figure 12). Egypt and Lebanon, which have witnessed significant political instability and economic hardships, are in the same group.
Peru has registered the highest global decline in quality-adjusted human development challenges through solid reforms that increased public expenditures on health, education and infrastructure, and led to lower inequality and poverty.[6] Following economic and social achievements since the early 2000s,[7] Türkiye also appears among the top 10 countries globally in improvements, along with four countries from sub-Saharan Africa. It is more difficult for a country starting from a point of relatively low challenges to make noticeable improvements, which explains the presence of high-and very high-challenge countries in the group with the greatest improvements.
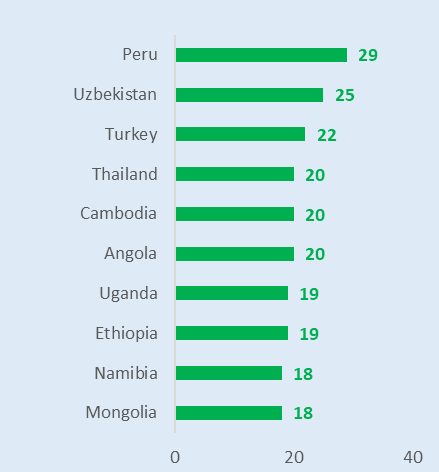
Figure 12. Top 10 deteriorations (left) and improvements (right) in rank on the quality-adjusted human development index, 2000-2020
(A) Top 10 deteriorations in rank |
(B) Top 10 improvements in rank |
|
|
|
Source: ESCWA calculations.
While all countries’ HDI scores were discounted by quality-adjustment variables to calculate the index, some were more affected than others (figure 13). Some outliers have fewer quality-adjusted human development challenges than other countries with similar HDI ranks. For example, Ukraine has the highest rank improvement on the quality-adjusted human development index compared with the standard HDI. This is because Ukraine is the best performer in reducing income inequality. Following Ukraine, Viet Nam, Uzbekistan, Moldova and Kyrgyzstan, respectively, saw the best improvements.
Among countries with the best improvements in rank, 7 of the top 10 are from Europe and Central Asia. The remaining countries are from East Asia and the Pacific (two) and the Arab region (one). Some countries below the regression line have higher challenges than other countries with similar HDI levels. One is Bahrain, with the greatest loss in rank, mainly due to poor performance on the inequality-adjusted income component compared with a very high HDI income score. Poor income performance is driven by factors including low-quality education for poor families resulting in fewer chances of getting jobs with appropriate salaries, which exacerbates income inequality.[8] The top 10 countries in terms of the greatest deteriorations in rank include four from Latin America and the Caribbean, three from sub-Saharan Africa, two from the Arab region and one from North America.
Figure 13. Quality-adjusted human development challenge index rank and HDI rank, 2020

Source: ESCWA calculations.