Table of contents:
Correlations with other global indices
How does the narrative of development challenges presented in the previous section differ from those offered by other leading global indices of development progress? This section considers this question, focusing on three indices with common conceptual and methodological grounds: the HDI, the SDGI and the SPI.
Nearly all 20 of the highest-performing countries on the HDI are in the least-challenged group of the DCI, with very high rank and score correlation. For the Nordic and most Northern European countries, the DCI will not make much difference. For medium and low HDI country groups, differences in scores and ranks are significant (figure 6).
Human development assessments can change dramatically for some countries depending on the index. This is glaringly obvious for the Arab Gulf Cooperation Council (GCC) countries. All belong to the very high HDI group. By shifting from the HDI to the DCI, however, Bahrain, Oman and Saudi Arabia showed enormous losses in rank. So did oil-rich East European and Central Asian countries, such as Belarus and Kazakhstan. Jordan and Tunisia had significant improvements on the DCI relative to the HDI, underscoring how even within a region, the DCI can significantly change assessment of human development achievements and progress. It effectively penalizes resource-abundant countries that have major governance deficits, have failed to diversify their economies and have substantial environmental sustainability challenges from energy-intensive production and consumption patterns.
The biggest rank improvements were in small resource-poor economies with good governance and sound environmental sustainability performance, such as Cabo Verde, as well as larger economies that have witnessed significant economic structural transformation in recent years, such as Indonesia.
Figure 6. Comparing how countries fare on the HDI and DCI
(A) Countries based on index scores
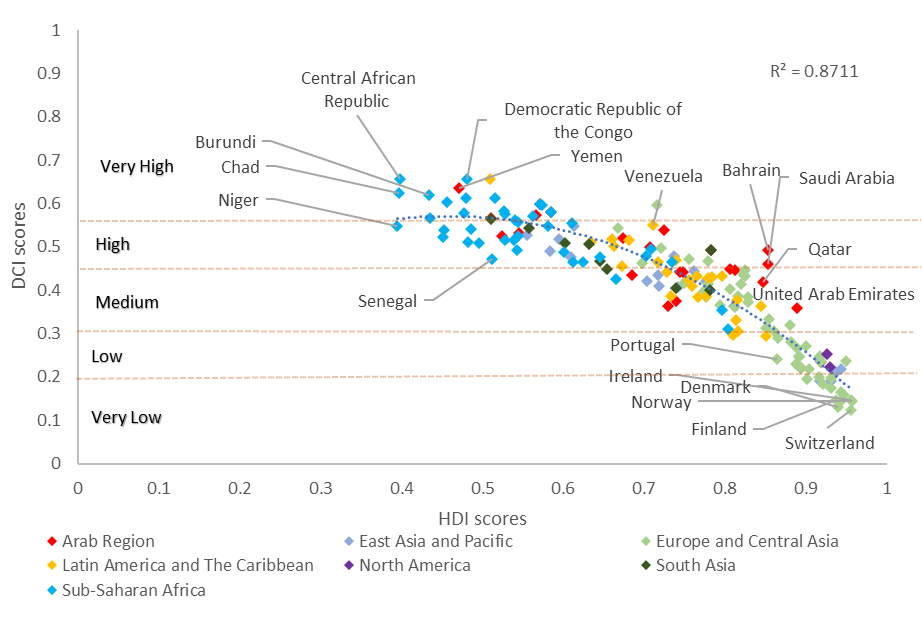
Source: ESCWA calculations.
(B) Countries based on index ranks
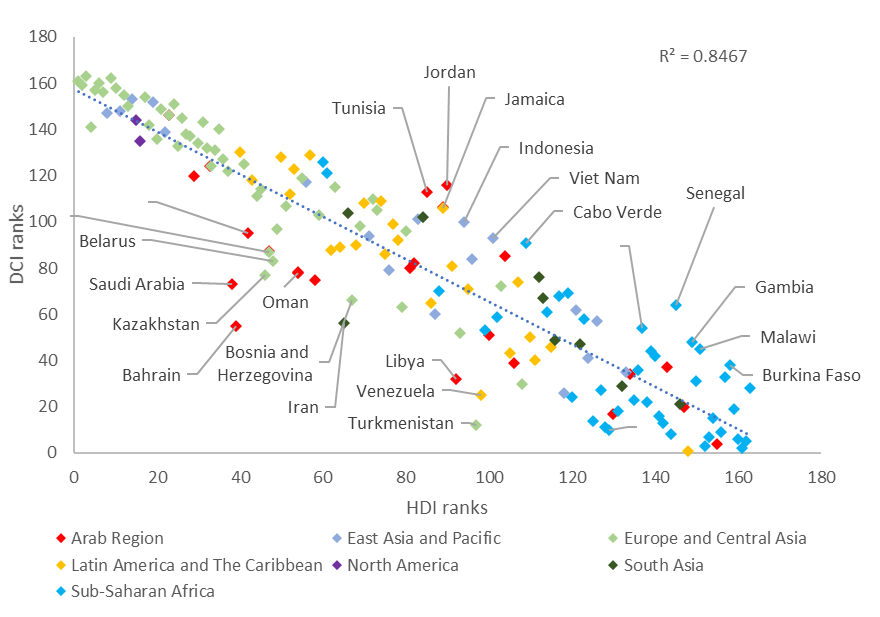
Source: ESCWA calculations.
Although the SDGI’s overall correlation with the DCI is quite strong, the relationship diverges from the HDI (figure 7). This is not surprising since the SDGI includes more diverse dimensions and indicators to measure progress on the 17 SDGs. One notable difference is that the dispersion is quite high all over the graph, including on the lower right side, where medium-to high-performing countries on the SDGI and low-and very low-challenge countries on the DCI are located. The higher dispersion indicates that the differences in rank between the SDGI and the DCI will be notable even where broader regional development patterns remain the same. Regional rankings would not be much different. Sub-Saharan Africa would still be the least-performing region and Europe and Central Asia the best-performing region.
Figure 7. The SDGI and the DCI
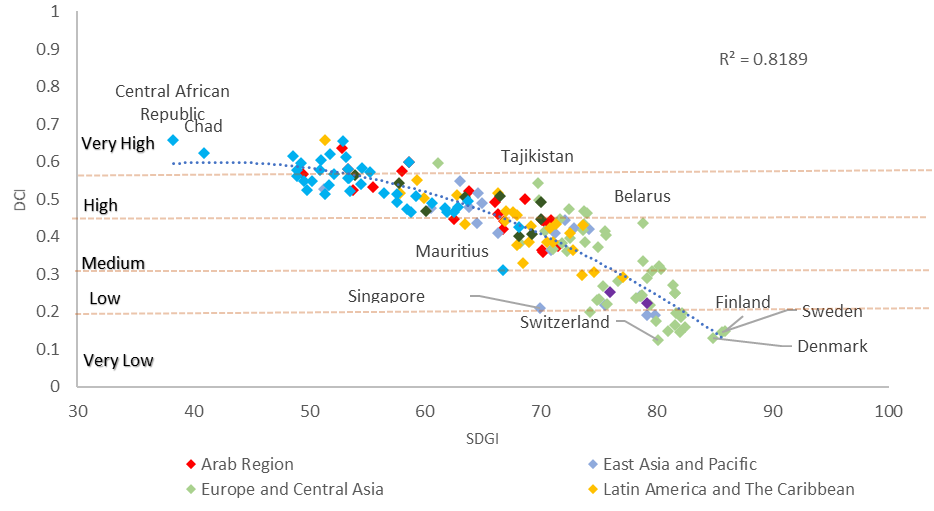
Source: ESCWA calculations and United Nations, 2021.
Note: The SDGI is an evaluation of each country’s overall performance on the 17 SDGs, weighting each goal equally. The score indicates a country’s position between the worst outcome (0) and the desired outcome (100).
Figure 8. The SPI and the DCI, 2020
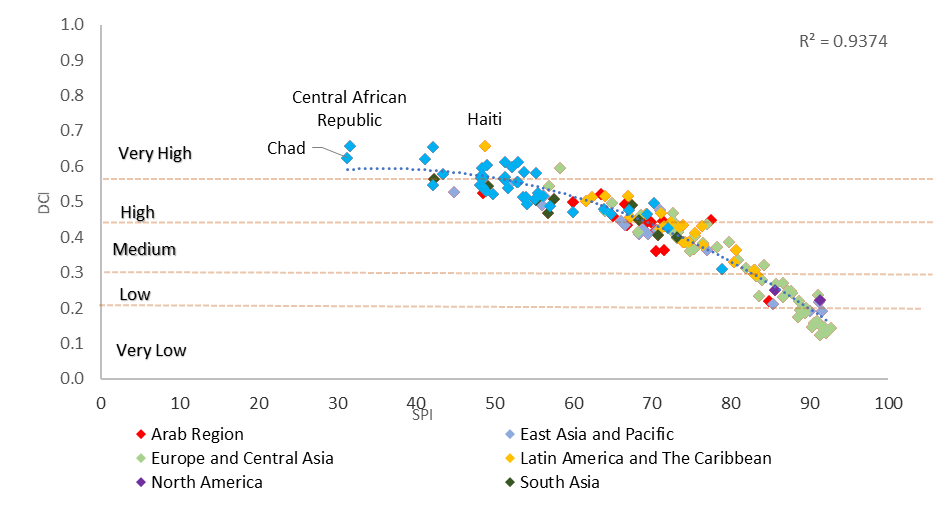
Source: 2020 Social Progress Index, www.socialprogress.org/index/global.
Comparing the DCI with the SPI is of special interest since the two have the highest correlation. This is not surprising since the SPI measures the extent to which countries meet the social and environmental needs of their citizens. It encompasses many indicators, including on governance and personal freedom, that correspond with the DCI indicators.[1]
As with the HDI, this correlation is highest for the very low-, low-and medium-challenge countries on the DCI, depicted by low dispersion from the regression line (figure 8). This dispersion starts to increase for high-and very high-challenge countries, which gives the plot a funnel-like shape. Although both the DCI and SPI look at a broader measure of well-being and consider the freedom of choice, an important distinction is that the DCI has half the indicators of the SPI. The SPI, like the HDI, focuses on achievements.
Finally, clear non-linearity in the relationship between the DCI and SPI is also evident with the SDGI and the HDI. After a certain threshold of development progress, specifically, after reaching a medium level of challenges on the DCI, the path to further progress becomes easier. This is a compelling justification for an analytical and measurement framework that shifts the focus to the poorest and most challenged countries.
[1]. The index combines three dimensions: basic human needs, foundations of well-being and opportunity. Each dimension includes four components, with each composed of between three and five specific outcome indicators. For more information visit: https://www.socialprogress.org/index/global.