Table of contents:
Decent work and the Fourth Industrial Revolution
Employment is vital to quality human development achievements, especially the income dimension. Through employment, quality education can translate into higher and better-distributed incomes. Employment in general and youth employment in particular remain pressing challenges in most countries, however, especially those in the low-income group.
Globally, the total unemployment rate for those aged 15 and above was 6.6 per cent in 2019. The rate for youth (aged 15-24) was 15.2 per cent, more than double the overall rate. Total and youth unemployment rates were 5.6 per cent and 9.1 per cent, respectively, in low-income countries.
While the unemployment rate is an important indicator for labour market performance, it cannot provide a full picture. In fact, lower unemployment in low-income countries compared to the global average could arise from several reasons, including the inability of many people to afford being unemployed, which forces them to accept any job. High rates of informality and vulnerability occur in more challenged, lower-income countries. For instance, 62 per cent of total employment worldwide is informal compared to a much higher 88 per cent in low-income countries.[1] The share of vulnerable employment in total employment is 44 per cent globally compared to 79 per cent in low-income countries.[2]
The quantity of jobs alone is not sufficient. Jobs must be decent and high in productivity, providing safe and stable working conditions and incomes. Creating such jobs can support the transition towards knowledge-based economies, which ultimately rely on increasing skilled labour across sectors.
Decent work, income levels and distribution, and economic complexity correlate with each other. It is not surprising to see poor correlations between the unemployment rate and both the inequality-adjusted income challenge index and the vulnerable employment indicator (figures 18 and 19). This contrasts with a strong correlation between the vulnerable employment indicator and the inequality-adjusted income challenge index (figure 20).
Since decent jobs lead to more complex economies and in turn higher and better-distributed incomes, accounting for decent employment in development indices is important. While vulnerable employment is a good proxy for decent employment as shown by these correlations, the two concepts are not the same. For instance, decent employment entails decent working time, access to paid leave and career advancement opportunities, to name a few dimensions, which is by no means an easy task.[3] Therefore, vulnerable employment represents only one important aspect of a much broader concept.
This is also vital as the world is changing rapidly in the course of the Fourth Industrial Revolution, and gaps between developing countries and developed countries will widen due to the digital divide. For instance, exponentially increasing knowledge and productivity in some countries, leading to improved complexity, will help these countries to cope with the new technologies and changing demands. On the other hand, other countries will be left behind and unequipped with the skills needed amid these fundamental changes. It is therefore important to adopt active cabour market programmes (skill development and training for workers in particular) which will result in the creation of more decent and knowledge-intensive jobs that are less vulnerable to technological changes.
Figure 18. Inequality-adjusted income challenge index and unemployment rate
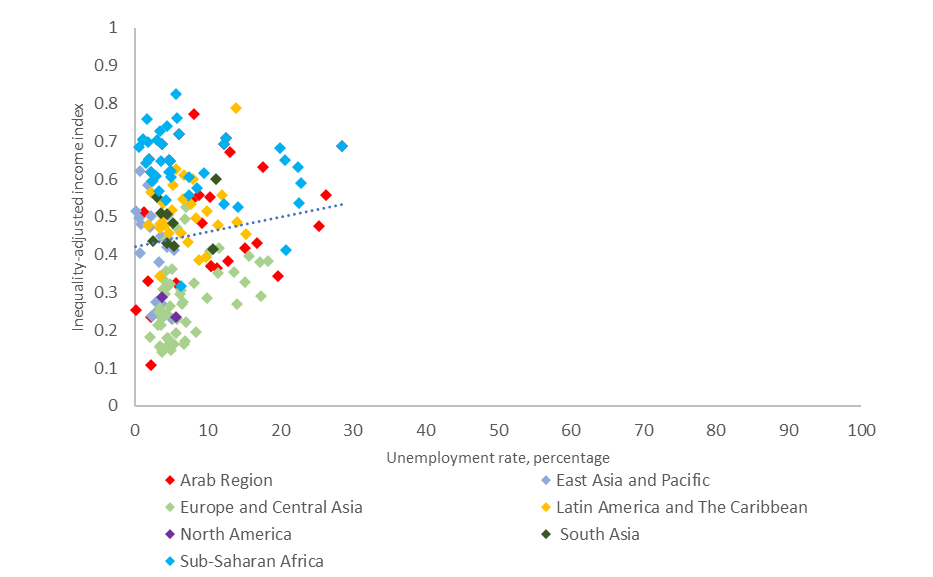
Source: ESCWA calculations and ILOSTAT.
Figure 19. Unemployment and vulnerable employment rates
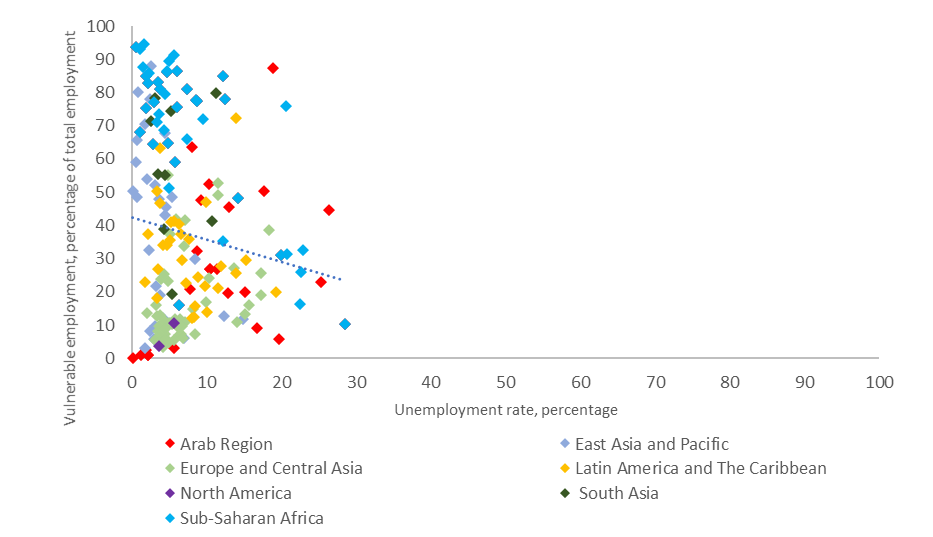
Source: ESCWA calculations and ILOSTAT, www.ilo.org/shinyapps/bulkexplorer20/?lang=en&segment=indicator&id=UNE_2EAP_SEX_AGE_RT_A.
Figure 20. Inequality-adjusted income challenge index and the vulnerable employment indicator
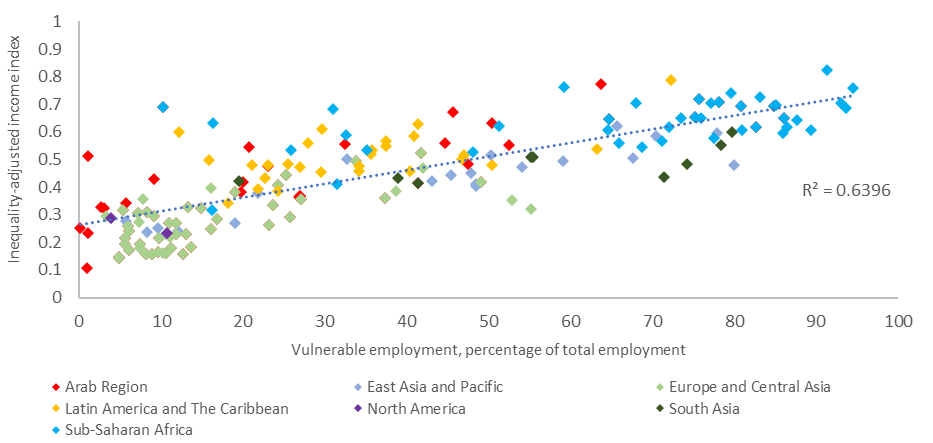
Source: ESCWA calculations and World Bank data, https://data.worldbank.org/indicator/SL.EMP.VULN.ZS.