جدول المحتويات:
Health and education system capacities and knowledge
There are high negative correlations between the healthy life expectancy challenge index and the capacity of the health system index, based on the simple average of the two indicators of the number of doctors and number of hospital beds per 1,000 individuals (figure 14). Similar patterns are evident between the quality-adjusted education challenge index and the pupil-teacher ratio index (figure 15). Both indices were rescaled so that a higher number of per capita doctors and/or hospital beds was associated with lower health challenges and a lower number of students per teacher was associated with lower educational challenges.
Poor health and educational outcomes in many countries are a logical result of insufficient institutional capacities, such as a lack of nearby hospitals, doctors or teachers. Outliers show differences in the use of resources, however. Many countries, especially in sub-Saharan Africa and the Arab region, have greater challenges than expected given their input indicators, which suggests poor use of health and education capacities. Countries below the regression line, such as the Nordic countries, likely demonstrate better use of available capacities.[1]
Figure 14. Healthy life expectancy challenge index and capacity of health system index
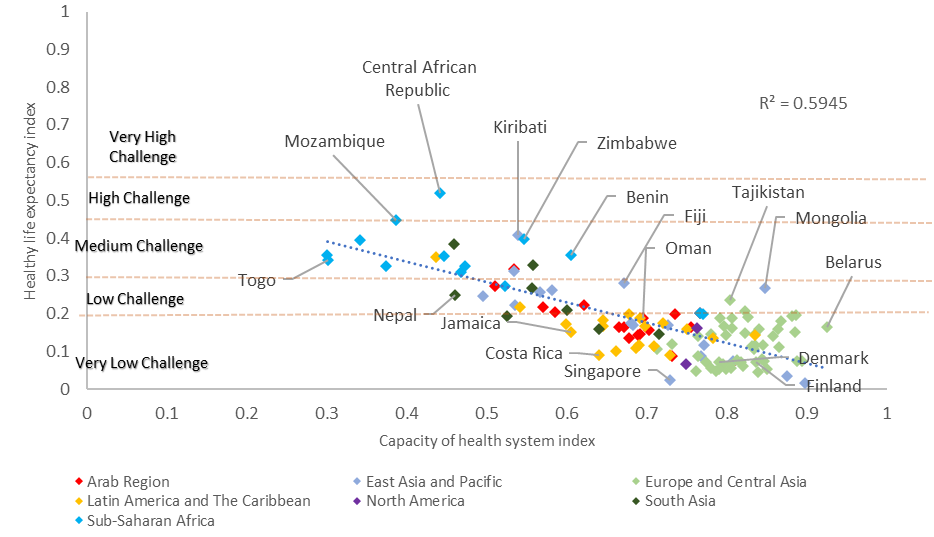
Source: ESCWA calculations.
Figure 15. Quality-adjusted education challenge index and pupil-teacher ratio index (Rescaled)
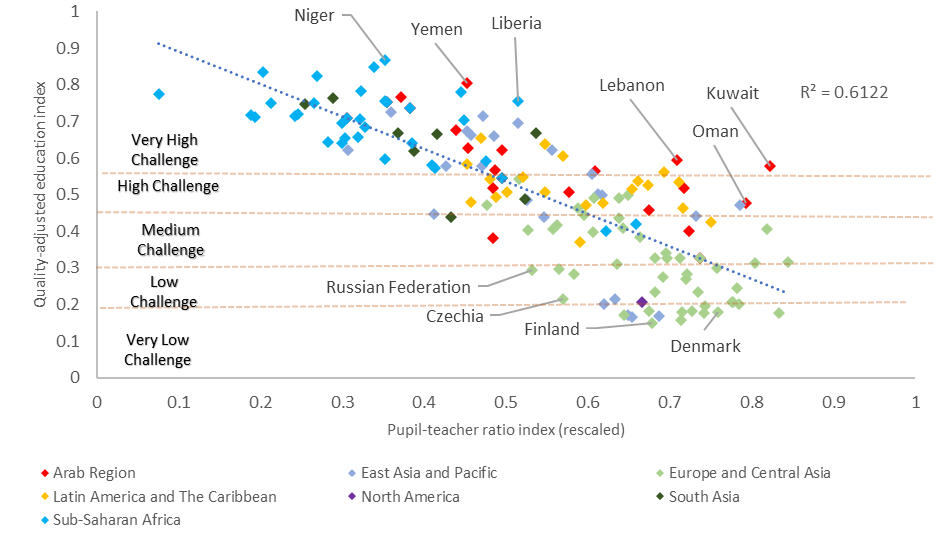
Source: ESCWA calculations.
Access to and use of technology is an important driver to consider given its direct influence on education quality and more generally on opportunities from the Fourth Industrial Revolution. One basic indicator of the use of technology that has wide country coverage is the number of Internet users as a percentage of the population. While this is not a good proxy for technological knowledge or skills, it still suggests the level of access to information, which is a key pillar of knowledge acquisition and quality education.
Consistent with this hypothesized nexus, there is a very strong correlation between the quality-adjusted education challenge index and Internet users (figure 16). Interestingly, most Arab and Latin American and Caribbean countries appear above the regression line while many European and Central Asian countries fall below it. This shows that when including these indicators, poorer and more challenged countries perform better than expected given their educational and overall developmental challenge levels. Less challenged countries in Europe and Central Asia perform worse, relatively. With technology in general and the Internet in particular, more widely available, performance on the Internet indicator is almost the same in high-and low-challenge countries. Exceptions remain, however, with sub-Saharan Africa negatively impacted by including such indicators mostly due to enduring – and in some cases widening – technology gaps.
Figure 16. Quality-adjusted education challenge index and Internet users
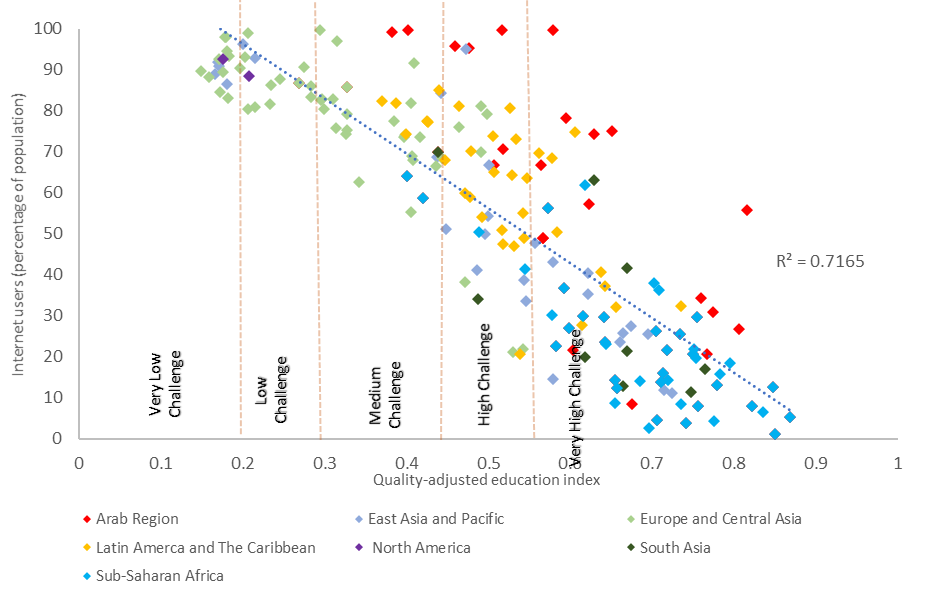
Source: ESCWA calculations.
A more important measure of technological advancement is the degree to which a country generates knowledge and ultimately translates it into human development gains. One index capturing this dimension is the economic complexity index. It naturally sits well with the quality-adjusted human development income and education challenge indices and correlates with the inequality-adjusted income challenge index (figure 17). This is in line with findings that show that the level of economic diversification and knowledge content of the production process predict current and future levels of income and possibly even income distribution.
Again, the presence of outliers is explained by the fact that some countries have greater efficiencies in the use of their economic resources, such as Finland and Norway. Others have lower efficiencies resulting in high inequality-adjusted income challenges relative to their level of economic complexity, such as Mexico and South Africa.
Figure 17. Inequality-adjusted income challenge index and economic complexity index
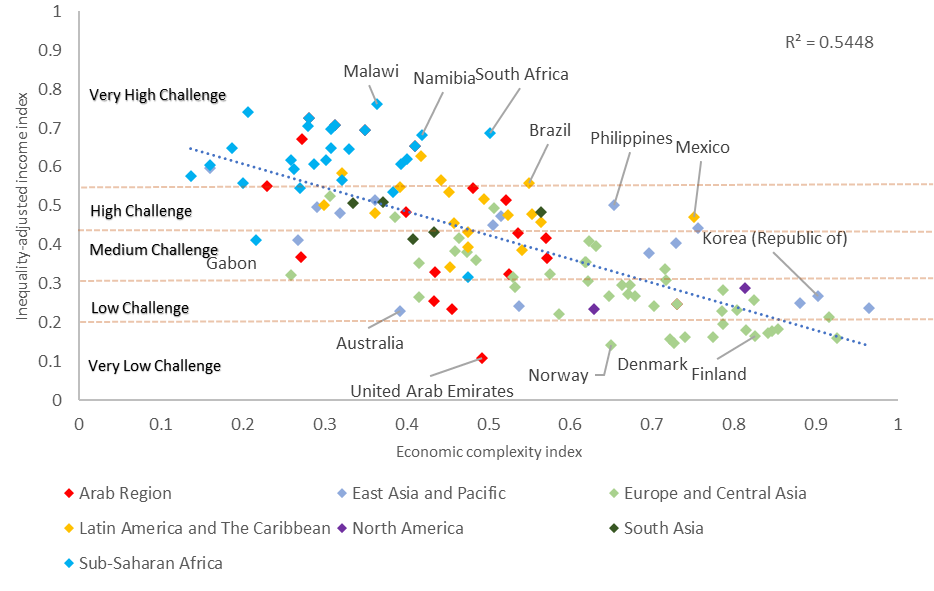
Source: ESCWA calculations and the Harvard Growth Lab, https://atlas.cid.harvard.edu/rankings.
Improving health and education sector capacities by increasing the numbers of doctors, hospital beds and teachers is essential to reducing quality-adjusted health and education challenges. So is higher investment in knowledge-intensive, high value-added sectors, as they tend to generate broad-based decent employment and improve economic complexity. These combined effects will diminish inequality-adjusted income challenges, especially with the increasing digitalization which will gravely affect low-skill, low-wage jobs. That said, today’s technological trends will further increase the inequality-adjusted income challenge if these root causes are not addressed.
[1]. Ibid.