Table of contents:
B. Structure of service provision
As of the third quarter of 2022, Maarja Support Center had a total of 70 employees for all of the different services offered, of which 25 employees conducted special care services as part of interval care leading to independent living. Service capacity was as follows:
- Support for daily activities: 4 places.
- Support for daily activities for persons with autism spectrum disorders: 2 places.
- Interval care for preparing for independent living: 14 places.
- Supported living: 2 places.
- Supported employment: 10 places.
Figure 2. Paid taxes, taxable turnover and number of employees for Maarja Support Center, 2020–2022
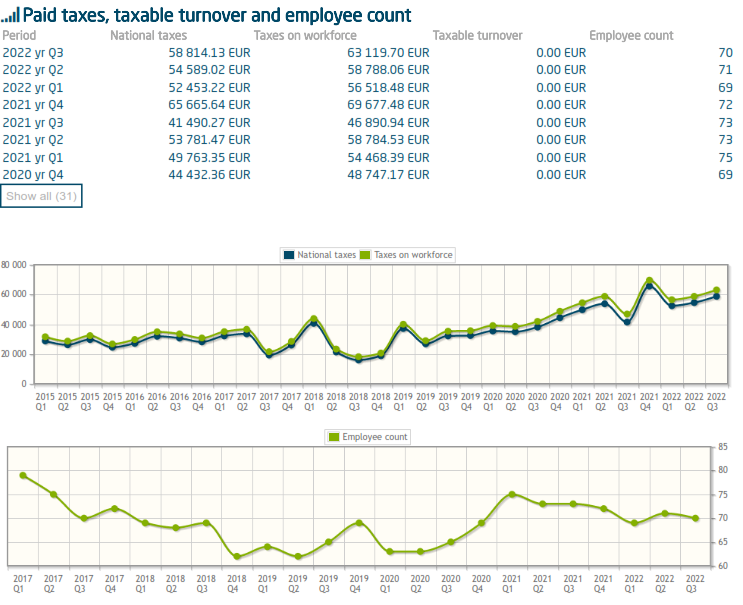
The figures show an increase in income tax. While the number of employees is currently rather stable, it has decreased slightly since early 2021.[1]
[1] An overview of legal bodies’ employees and taxes can be found using the Teatmik.ee search portal: Teatmik.ee (n.d.).