Table of contents:
Overall Prevalence Rates in the Region
Countries in the region report relatively low prevalence of disability, with rates lower than 2 per cent in eight out of 14 countries, and as low as 0.2 per cent in Qatar and 1 per cent in Mauritania (figure 2). Morocco and Sudan have the highest prevalence rates at 5.1 per cent and 4.8 per cent, respectively.
Figure 2: Disability prevalence rates in countries across the region (different years), total and female/male
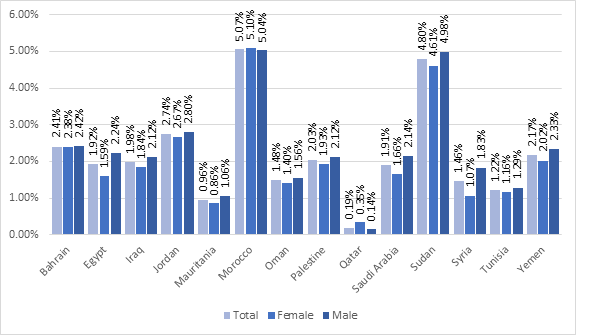
Source: Calculated from Arab Disability Statistics in Numbers 2017, based on data compiled and verified from NSOs from the following censuses and surveys: Bahrain Census 2010, Egypt Labor Force Survey (LFS) 2016, Iraq Poverty and Maternal Mortality Survey (I-PMM) 2013, Jordan Census 2015, Mauritania Census 2013, Morocco Census 2014, Oman Census 2010, Palestine Census 2007, Qatar Census 2010, Saudi Arabia Demographic and Health Survey (DHS) 2016, Sudan Census 2008, Syria Budget Survey 2007, Tunisia Census 2014, Yemen Household Budget Survey (HBS) 2014.
The low prevalence rate reported by Qatar may be explained by the fact that their data are not limited to nationals, but also comprise migrant workers, who are extremely unlikely to have or to declare a disability. The Qatar 2010 census found that non-Qataris made up 86.7 per cent of the population. Additional data from the Qatar Statistics Authority confirm that a count of only Qataris increases the prevalence rate from 0.2 per cent to 1.7 per cent.[1]
The differences among countries reflect not only difference in actual prevalence rates, but also differences in definitions and methodologies (table 2). Some countries do not use all six of the WGSS domains referred to in the text box, as will be further discussed below. Others apply a screening question, “Do you have a disability/difficulty?”, prior to using the WGSS (Egypt, Oman, Saudi Arabia, Tunisia). In countries that have not adopted the WGSS, some questions contain the word “disability” which discourages reporting in contexts with strong disability stigma and consequently records only the most severe cases. Similarly, questions that ask about “normal functioning” may underreport groups that perceive their conditions to be typical for their situations, for example older persons who encounter considerable difficulty in walking or seeing but do not consider themselves as having a disability.[2] Furthermore, it is unclear whether, or to which extent, persons with disabilities living in institutions – such as care homes and prisons – are included.[3]
| Country | Survey/Census and Year | Use of screening question* | Question asks about normal functioning | Question uses the word disability | Levels of difficulty** (WGSS or Yes/No) | Domains of difficulty (WGSS domains or Other) |
|---|---|---|---|---|---|---|
| Bahrain | Census 2010 | x | x | Yes/No | WGSS domains, excluding “self-care”, adding “multiple” and “other” | |
| Egypt | Labor Force Survey (LFS) 2016 | x | x | WGSS | WGSS | |
| Iraq | Poverty and Maternal Mortality Survey (I-PMM) 2013 | WGSS | WGSS domains, excluding “self-care” | |||
| Jordan | Census 2015 | WGSS | WGSS | |||
| Mauritania | Census 2013 | x | Yes/No | Not WGSS, including: “movement”, “deaf/mute”, “vision”, “mental”, “multiple”, and “other” | ||
| Morocco | Census 2014 | WGSS | WGSS | |||
| Oman | Census 2010 | x | x | WGSS | WGSS domains, adding “upper body movement” | |
| Palestine | Census 2007 | WGSS | WGSS domains, excluding “self-care” | |||
| Qatar | Census 2010 | WGSS | WGSS domains, adding “talking” and “other” | |||
| Saudi Arabia | Demographic and Health Survey (DHS) 2016 | x | WGSS | WGSS, adding “other” | ||
| Sudan | Census 2008 | Yes/No | Not WGSS. Including: “limited use/loss of leg(s)”, “limited use/loss of arm(s)”, “difficulty in hearing/deaf”, “difficulty in seeing/blind”, “difficulty in speaking/mute”, “mental disability” | |||
| Syrian Arab Republic | Budget Survey 2007 | x | Yes/No | WGSS domains, excluding “self-care”, adding “multiple” | ||
| Tunisia | Census 2014 | x | WGSS | WGSS | ||
| Yemen | Household Budget Survey (HBS) 2014 | WGSS | WGSS |
* “Do you have a disability/difficulty?”
** WGSS includes four levels of difficulty: no difficulty, some difficulty, a lot of difficulty, and cannot do at all. Yes/No includes two options: Yes, with difficulty or No, without difficulty.
Source: ESCWA, 2018.
The Washington Group methodology recommends using the two highest levels of difficulty (“a lot of difficulty” or “cannot do at all”) in at least one of the six domains as the cut-off point for classifying a person as having a disability. The prevalence rates therefore do not count those who have moderate difficulty. However, this is a recommendation and not a strict requirement. Applying all four levels of difficulty of the WGSS in surveys and censuses allows for a more nuanced analysis of the prevalence of disability and more sophistication in policy formulation and programme planning. For example, 2.7 per cent of the population in Jordan are classified as “having a disability” according to the WGSS recommended cut-off, but if those who experience “some difficulty” are included, the number jumps to 11.4 per cent. Similarly, the rate in Morocco increases from 5.1 per cent to 11.1 per cent and the one in Yemen from 2.2 per cent to 6.8 per cent.
In most Arab countries, the prevalence rates are higher among men than among women (figure 2). This gap is widest in the Syrian Arab Republic, where the male prevalence rate is 1.8 per cent and the female one 1.1 per cent. Morocco and Qatar are the exceptions to the pattern. In Qatar, notably, the female prevalence rate of 0.3 per cent is three times higher than the male, at 0.1 per cent. This is due to the fact that migrant workers in the country – who, as noted, are extremely unlikely to have disabilities – are overwhelmingly male. Counting only Qatari nationals, the rates are more equal, at 1.5 per cent for women and 1.9 per cent for men.[4]
The fact that disability prevalence rates vary considerably between countries could also be an effect of the age composition in each one of them. Disability is positively correlated with ageing: the rate starts to increase around middle age and rises sharply for older persons (figure 3).
In all countries, disability prevalence stays below 3 per cent for persons aged 25-44 years, and generally under 5 per cent for ages 45-64 years, except for Morocco where it reaches 8.7 per cent among this group. The rate then rises drastically among those aged 65 years and above. For example, in Oman, the disability prevalence rate rises from 2.8 per cent for those aged 45-64 years to 15.8 per cent for those aged 65 and older, an almost sixfold increase. In Yemen, similarly, the rate climbs from 3.5 per cent to 20 per cent between these age groups. [5]
Figure 3: Disability prevalence rates by age group
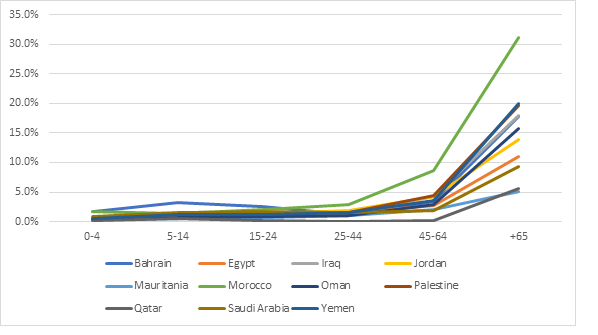
Source: Calculated from Arab Disability Statistics in Numbers 2017, based on data compiled and verified from National Statistics Offices (NSOs) from the following censuses and surveys: Bahrain Census 2010, Egypt Labor Force Survey (LFS) 2016, Iraq Poverty and Maternal Mortality Survey (I-PMM) 2013, Jordan Census 2015, Mauritania Census 2013, Morocco Census 2014, Oman Census 2010, Palestine Census 2007, Qatar Census 2010, Saudi Arabia Demographic and Health Survey (DHS) 2016, Yemen Household Budget Survey (HBS) 2014.
Note: The lowest age group for Egypt is 6-14.
Estimates from studies around the world show that young men have a higher disability rate than young women.[6] There is some evidence that this starts to reverse around the age of 50.[7] Among those 65 years and older, women consistently report a higher prevalence of disability than men. Countries in the Arab region generally follow this global pattern. The proportion of women among persons with disabilities is lowest in the age span 35-44 years, where it does not exceed 40 per cent in any country except Morocco and Mauritania (figure 4). After that, however, the female proportion increases drastically so that among persons with disabilities over 65, women are clearly in the majority.[8]
Figure 4: Women as percentage of persons with disabilities
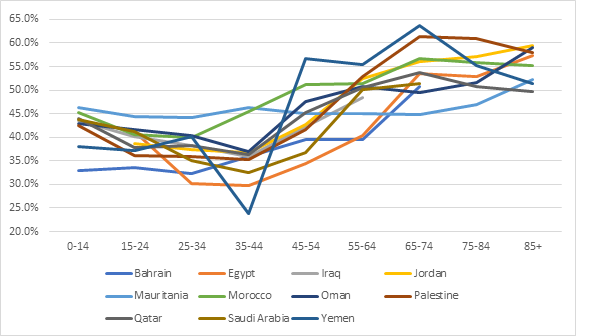
Sources: Calculated from Arab Disability Statistics in Numbers 2017, based on data compiled and verified from National Statistics Offices (NSOs) from the following censuses and surveys: Bahrain Census 2010, Egypt Labor Force Survey (LFS) 2016, Iraq Poverty and Maternal Mortality Survey (I-PMM) 2013, Jordan Census 2015, Mauritania Census 2013, Morocco Census 2014, Oman Census 2010, Palestine Census 2007, Qatar Census 2010, Saudi Arabia Demographic and Health Survey (DHS) 2016, Yemen Household Budget Survey (HBS) 2014.
Note: Some countries have not provided disaggregated data for the entire age spectrum, which is why their lines are incomplete.
The higher disability rate among older women may be due not only to their higher life expectancy, but also to the male-female health-survival paradox, meaning that women experience greater longevity than men, but also more disability and poorer health.[9] The proportion of older women in Arab countries is not always significantly larger than that of older men, yet among older persons with disabilities the female proportion is considerably larger than the male one.
The fact that the types and causes of disability tend to differ depending on gender, which will be explained more fully in the succeeding paragraphs, might also help explain the uneven representation of women and men among persons with disabilities in the various age groups. It may also be that the disability stigma particularly affects girls and young women, making underreporting more common among this group. As mentioned above, persons with disabilities living in institutions are not necessarily included in national censuses and surveys, which may also affect the overall picture. For instance, if young women with disabilities are disproportionately likely to live in institutions, they will as a result be underrepresented in censuses and surveys.
Older persons are strongly overrepresented among persons with disabilities. Among persons without disabilities, the proportion who are aged 65 and older ranges between 0.8 per cent (Qatar) and 5.3 per cent (Jordan). However, among persons with disabilities, it varies between 15.7 per cent (Bahrain) and 37.5 per cent (Oman). In Palestine, persons aged 65 and above make up merely 3 per cent of the population without disabilities, but 29.4 per cent of the population with disabilities. Since most countries in the region have relatively young populations, the prevalence of disability will likely grow in the future as the average age rises.
Figure 5: Percentage of people aged 65 years and older among persons with and without disabilities
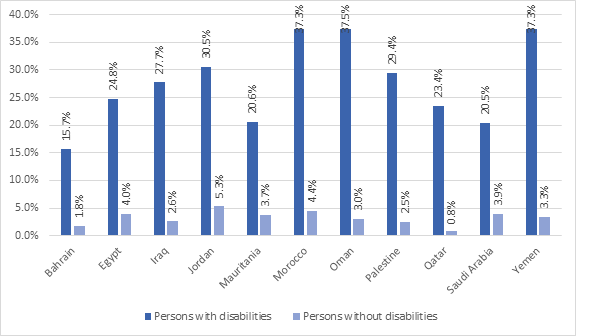
Source: Calculated from Arab Disability Statistics in Numbers 2017, based on data compiled and verified from National Statistics Offices (NSOs) from the following censuses and surveys: Bahrain Census 2010, Egypt Labor Force Survey (LFS) 2016, Iraq Poverty and Maternal Mortality Survey (I-PMM) 2013, Jordan Census 2015, Mauritania Census 2013, Morocco Census 2014, Oman Census 2010, Palestine Census 2007, Qatar Census 2010, Saudi Arabia Demographic and Health Survey (DHS) 2016, Yemen Household Budget Survey (HBS) 2014.
[1] Based on Qatar Statistics Authority, 2010, tables 103 and 104. The calculation applies only to the national population aged 10 and above.
[2] Washington Group on Disability Statistics, 2009. Morocco, which has the highest disability rate in the region, is one of the few countries that applies all six WGSS domains and does not ask questions that may cause underreporting.
[3] This issue is the subject of an ongoing ESCWA research project.
[4] Based on Qatar Statistics Authority, 2010, table 103. The calculation applies only to the national population aged 10 and above.
[5] A certain correlation can be discerned between high disability prevalence and a large proportion of older persons within the overall population. However, this correlation is very uneven. See ESCWA, 2017, p. 16, for a graphic illustration.
[6] World Health Organization and World Bank, 2011, p. 30.
[7] Mitra, 2017; Hosseinpoor and others, 2016.
[8] In Qatar, notably, the disability rate among those above 65 years is almost 30 times higher than those aged 45-64, and 56 times higher than among those aged 25-44. Qatar and Bahrain, furthermore, are the only countries where the disability rates are higher among those aged 5-14 than among those aged 15-44. This is a consequence of the fact that migrant workers are generally of working age.
[9] Alberts and others, 2014.