Table of contents:
Iraq 2013
Source: Calculated from ESCWA, 2017a, based on data provided by the NSO from the Iraq Poverty and Maternal Mortality Survey 2013, unless otherwise indicated
Population
Total female population: 16,923,843 (49.48%)
Total male population: 17,281,194 (50.52%)
Total population: 34,205,037
Total female persons with disabilities: 311,542 (45.98%)
Total male persons with disabilities: 365,950 (54.02%)
Total persons with disabilities: 677,492
Disability prevalence (%)
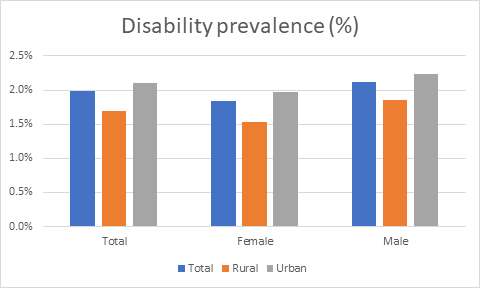
| Total | Rural | Urban | |
|---|---|---|---|
| Total | 1.98% | 1.70% | 2.10% |
| Female | 1.84% | 1.54% | 1.97% |
| Male | 2.12% | 1.85% | 2.23% |
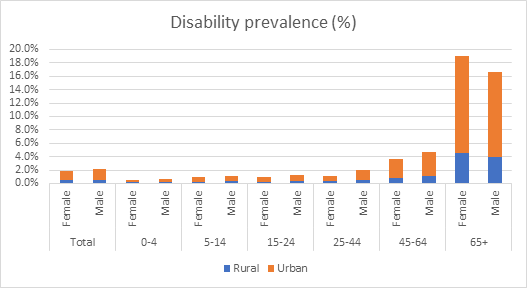
Age-specific disability prevalence (%)
| Rural | Urban | Total | ||
|---|---|---|---|---|
| Total | Female | 0.5% | 1.4% | 1.8% |
| Male | 0.6% | 1.6% | 2.1% | |
| 0-4 | Female | 0.1% | 0.3% | 0.5% |
| Male | 0.2% | 0.4% | 0.6% | |
| 5-14 | Female | 0.3% | 0.7% | 0.9% |
| Male | 0.4% | 0.8% | 1.1% | |
| 15-24 | Female | 0.3% | 0.7% | 0.9% |
| Male | 0.4% | 0.9% | 1.3% | |
| 25-44 | Female | 0.3% | 0.8% | 1.1% |
| Male | 0.5% | 1.5% | 1.9% | |
| 45-64 | Female | 0.8% | 2.9% | 3.7% |
| Male | 1.1% | 3.6% | 4.7% | |
| 65+ | Female | 4.6% | 14.4% | 19.0% |
| Male | 4.0% | 12.6% | 16.6% | |
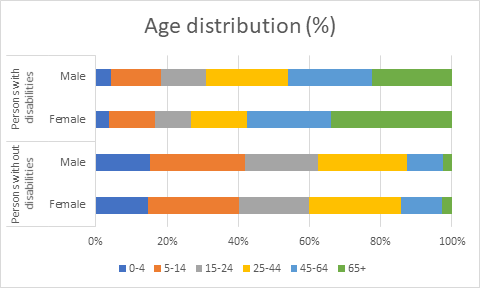
Age distribution (%)
| 0-4 | 5-14 | 15-24 | 25-44 | 45-64 | 65+ | ||
|---|---|---|---|---|---|---|---|
| Persons without disabilities | Female | 14.6% | 25.5% | 19.7% | 25.9% | 11.6% | 2.7% |
| Male | 15.1% | 26.6% | 20.6% | 24.9% | 10.3% | 2.4% | |
| Persons with disabilities | Female | 3.7% | 12.9% | 10.0% | 15.8% | 23.6% | 34.0% |
| Male | 4.3% | 14.0% | 12.7% | 22.9% | 23.7% | 22.4% | |
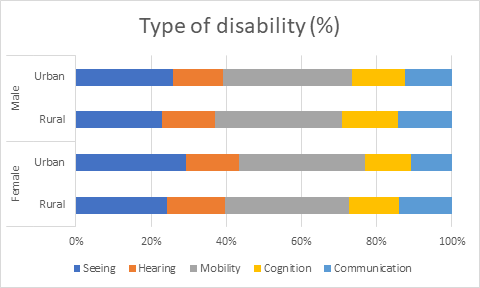
Type of disability/difficulty (%)
| Seeing | Hearing | Mobility | Cognition | Communication | ||
|---|---|---|---|---|---|---|
| Female | Rural | 24.4% | 15.3% | 32.8% | 13.4% | 14.1% |
| Urban | 29.3% | 14.1% | 33.6% | 12.1% | 11.0% | |
| Male | Rural | 23.0% | 13.9% | 33.9% | 14.8% | 14.4% |
| Urban | 25.9% | 13.3% | 34.2% | 14.2% | 12.3% | |
Note: Persons may report more than one type of disability.
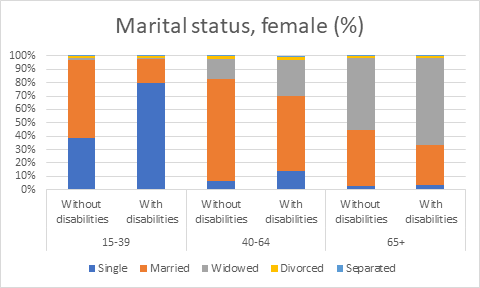
| Single | Married | Widowed | Divorced | Separated | ||
|---|---|---|---|---|---|---|
| 15-39 | Without disabilities | 38.9% | 58.2% | 1.3% | 1.4% | 0.1% |
| With disabilities | 79.5% | 18.0% | 1.2% | 1.1% | 0.2% | |
| 40-64 | Without disabilities | 6.2% | 76.7% | 15.0% | 1.7% | 0.4% |
| With disabilities | 13.8% | 56.1% | 26.8% | 2.4% | 0.9% | |
| 65+ | Without disabilities | 3.0% | 41.5% | 54.0% | 1.2% | 0.3% |
| With disabilities | 3.5% | 30.0% | 64.7% | 1.5% | 0.3% | |
Cause of disability (%)
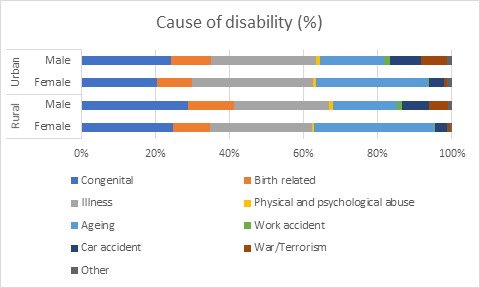
| Congenital | Birth-related | Illness | Physical and psychological abuse | Ageing | Work accident | Car accident | War/Terrorism | Other | ||
|---|---|---|---|---|---|---|---|---|---|---|
| Rural | Female | 24.9% | 10.0% | 27.4% | 0.7% | 32.2% | 0.5% | 3.2% | 0.7% | 0.6% |
| Male | 28.7% | 12.5% | 25.7% | 1.1% | 17.3% | 1.2% | 7.3% | 5.2% | 1.0% | |
| Urban | Female | 20.5% | 9.4% | 32.7% | 0.6% | 30.2% | 0.4% | 3.9% | 0.9% | 1.3% |
| Male | 24.1% | 10.8% | 28.4% | 1.2% | 17.1% | 1.8% | 8.4% | 6.9% | 1.3% | |
Note: Persons may report more than one cause of disability.
By marital status by age group
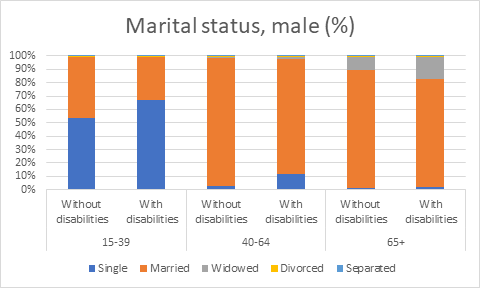
| Single | Married | Widowed | Divorced | Separated | ||
|---|---|---|---|---|---|---|
| 15-39 | Without disabilities | 53.9% | 45.0% | 0.2% | 0.8% | 0.1% |
| With disabilities | 66.9% | 32.0% | 0.3% | 0.7% | 0.1% | |
| 40-64 | Without disabilities | 2.4% | 96.0% | 0.8% | 0.6% | 0.1% |
| With disabilities | 11.7% | 85.9% | 1.7% | 0.6% | 0.1% | |
| 65+ | Without disabilities | 1.0% | 88.4% | 10.0% | 0.4% | 0.1% |
| With disabilities | 2.1% | 80.7% | 16.4% | 0.7% | 0.1% | |
Note: 205,753 persons of unknown marital status, amounting to 1.01 per cent of the total population aged 15 and above, have been excluded from the calculation since no disaggregation by disability is available for this group.
By literacy status age: 15+ years
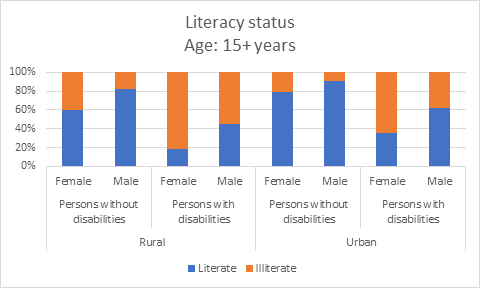
| Literate | Illiterate | |||
|---|---|---|---|---|
| Rural | Persons without disabilities | Female | 59.5% | 40.5% |
| Male | 82.3% | 17.7% | ||
| Persons with disabilities | Female | 18.5% | 81.5% | |
| Male | 45.5% | 54.5% | ||
| Urban | Persons without disabilities | Female | 79.1% | 20.9% |
| Male | 90.3% | 9.7% | ||
| Persons with disabilities | Female | 35.8% | 64.2% | |
| Male | 61.7% | 38.3% | ||
By school attendance
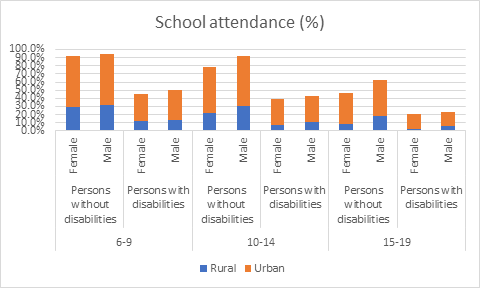
| Rural | Urban | Total | |||
|---|---|---|---|---|---|
| 6-9 | Persons without disabilities | Female | 29.1% | 62.9% | 92.1% |
| Male | 31.5% | 62.6% | 94.1% | ||
| Persons with disabilities | Female | 12.4% | 33.2% | 45.5% | |
| Male | 13.8% | 36.9% | 50.7% | ||
| 10-14 | Persons without disabilities | Female | 22.1% | 56.8% | 78.9% |
| Male | 30.4% | 61.8% | 92.3% | ||
| Persons with disabilities | Female | 7.0% | 32.3% | 39.4% | |
| Male | 11.4% | 31.7% | 43.2% | ||
| 15-19 | Persons without disabilities | Female | 8.1% | 38.1% | 46.1% |
| Male | 18.1% | 44.3% | 62.4% | ||
| Persons with disabilities | Female | 2.8% | 18.1% | 20.9% | |
| Male | 5.9% | 17.1% | 22.9% | ||
By educational attainment age: 6+ years
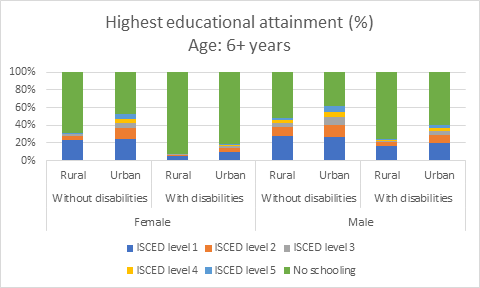
| ISCED level 1 | ISCED level 2 | ISCED level 3 | ISCED level 4 | ISCED level 5 | No schooling | |||
|---|---|---|---|---|---|---|---|---|
| Female | Without disabilities | Rural | 22.8% | 5.0% | 1.7% | 0.8% | 0.7% | 68.9% |
| Urban | 24.4% | 12.0% | 6.7% | 4.3% | 4.9% | 47.7% | ||
| With disabilities | Rural | 5.3% | 1.4% | 0.3% | 0.3% | 0.1% | 92.7% | |
| Urban | 10.1% | 3.8% | 2.0% | 1.8% | 1.1% | 81.2% | ||
| Male | Without disabilities | Rural | 28.0% | 10.0% | 4.9% | 2.4% | 2.6% | 52.0% |
| Urban | 26.7% | 13.8% | 8.9% | 5.0% | 7.1% | 38.5% | ||
| With disabilities | Rural | 16.2% | 4.3% | 2.0% | 1.1% | 1.1% | 75.3% | |
| Urban | 20.2% | 8.7% | 5.1% | 3.0% | 3.6% | 59.4% | ||
Note: Data source includes a more detailed breakdown for children aged 6-9 with “no schooling” (by primary school enrolment).
By economic activity age: 15–64 years
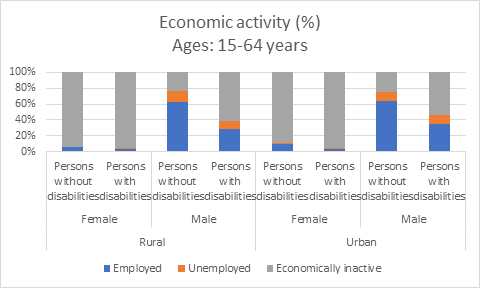
| Employed | Unemployed | Economically inactive | |||
|---|---|---|---|---|---|
| Rural | Female | Persons without disabilities | 5.6% | 0.8% | 93.5% |
| Persons with disabilities | 3.41% | 0.7% | 95.8% | ||
| Male | Persons without disabilities | 62.0% | 14.5% | 23.5% | |
| Persons with disabilities | 28.1% | 10.9% | 61.0% | ||
| Urban | Female | Persons without disabilities | 9.6% | 2.0% | 88.5% |
| Persons with disabilities | 3.7% | 1.0% | 95.3% | ||
| Male | Persons without disabilities | 63.3% | 12.3% | 24.4% | |
| Persons with disabilities | 34.4% | 11.6% | 54.0% | ||
By sector of employment
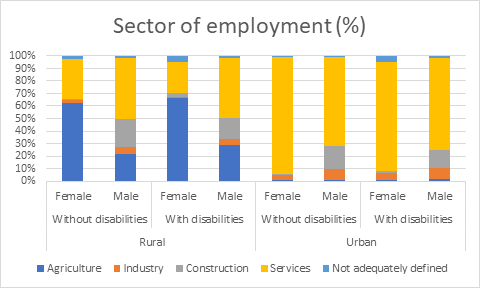
| Agriculture | Industry | Construction | Services | Not adequately defined | |||
|---|---|---|---|---|---|---|---|
| Rural | Without disabilities | Female | 62.4% | 2.3% | 1.0% | 32.0% | 2.2% |
| Male | 21.3% | 5.6% | 22.4% | 49.4% | 1.3% | ||
| With disabilities | Female | 66.0% | 1.5% | 2.8% | 24.7% | 5.0% | |
| Male | 28.9% | 5.0% | 16.7% | 47.6% | 1.8% | ||
| Urban | Without disabilities | Female | 0.8% | 4.2% | 1.0% | 92.8% | 1.2% |
| Male | 1.1% | 8.8% | 17.9% | 71.3% | 0.9% | ||
| With disabilities | Female | 0.5% | 5.7% | 1.8% | 87.0% | 5.0% | |
| Male | 2.0% | 8.4% | 14.4% | 73.2% | 2.0% | ||