Table of contents:
Oman 2010
Source: Calculated from ESCWA, 2017a, based on data provided by the NSO from the Oman census 2010, unless otherwise indicated
Population
Total female population: 966,746 (49.39%)
Total male population: 990,590 (50.61%)
Total population: 1,957,336
Total female persons with disabilities: 13,540 (46.75%)
Total male persons with disabilities: 15,423 (53.25%)
Total persons with disabilities: 28,963
Note: Data are for nationals only.
Disability prevalence (%)
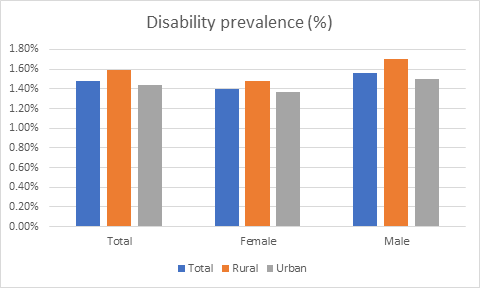
| Total | Rural | Urban | |
|---|---|---|---|
| Total | 1.48% | 1.59% | 1.43% |
| Female | 1.40% | 1.47% | 1.37% |
| Male | 1.56% | 1.70% | 1.50% |
Age-specific disability prevalence (%)
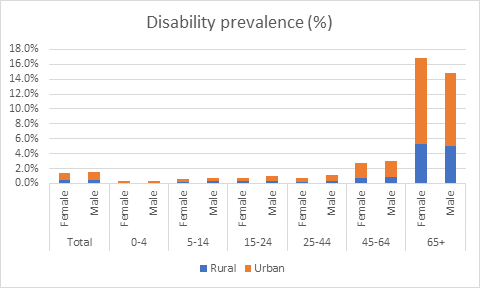
| Rural | Urban | Total | ||
|---|---|---|---|---|
| Total | Female | 0.4% | 1.0% | 1.4% |
| Male | 0.5% | 1.1% | 1.6% | |
| 0-4 | Female | 0.1% | 0.2% | 0.3% |
| Male | 0.1% | 0.2% | 0.3% | |
| 5-14 | Female | 0.2% | 0.4% | 0.6% |
| Male | 0.3% | 0.5% | 0.8% | |
| 15-24 | Female | 0.3% | 0.5% | 0.8% |
| Male | 0.3% | 0.7% | 1.0% | |
| 25-44 | Female | 0.2% | 0.5% | 0.7% |
| Male | 0.3% | 0.8% | 1.1% | |
| 45-64 | Female | 0.8% | 2.0% | 2.7% |
| Male | 0.9% | 2.1% | 3.0% | |
| 65+ | Female | 5.3% | 11.6% | 16.9% |
| Male | 5.0% | 9.8% | 14.8% | |
Age distribution (%)
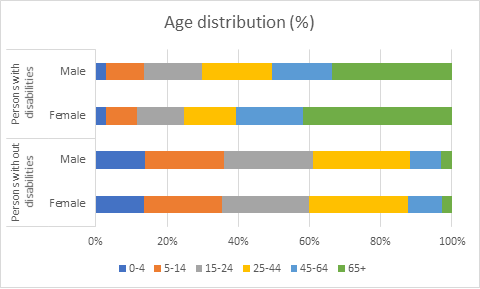
| 0-4 | 5-14 | 15-24 | 25-44 | 45-64 | 65+ | ||
|---|---|---|---|---|---|---|---|
| Persons without disabilities | Female | 13.5% | 21.8% | 24.6% | 27.7% | 9.5% | 2.9% |
| Male | 13.8% | 22.2% | 25.2% | 27.1% | 8.7% | 3.1% | |
| Persons with disabilities | Female | 2.8% | 8.9% | 13.2% | 14.6% | 18.7% | 41.8% |
| Male | 2.8% | 10.7% | 16.2% | 19.9% | 16.7% | 33.7% | |
Type of disability/difficulty (%)
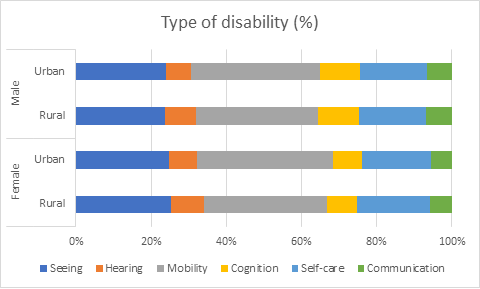
| Seeing | Hearing | Mobility | Cognition | Self-care | Communication | ||
|---|---|---|---|---|---|---|---|
| Female | Rural | 25.3% | 8.8% | 32.6% | 8.0% | 19.4% | 5.9% |
| Urban | 24.8% | 7.4% | 36.2% | 7.6% | 18.6% | 5.4% | |
| Male | Rural | 23.8% | 8.1% | 32.5% | 11.0% | 17.7% | 7.0% |
| Urban | 24.0% | 6.7% | 34.1% | 10.7% | 17.9% | 6.5% | |
By marital status by age group
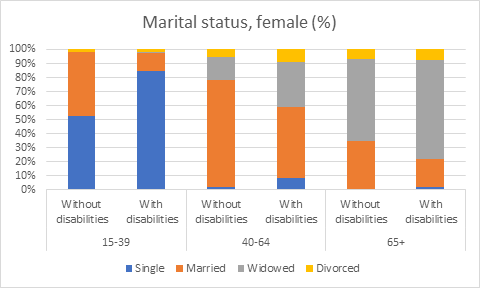
| Single | Married | Widowed | Divorced | ||
|---|---|---|---|---|---|
| 15-39 | Without disabilities | 52.5% | 45.3% | 0.5% | 1.6% |
| With disabilities | 84.7% | 12.6% | 0.8% | 1.9% | |
| 40-64 | Without disabilities | 1.8% | 76.5% | 16.3% | 5.5% |
| With disabilities | 8.2% | 50.7% | 31.9% | 9.2% | |
| 65+ | Without disabilities | 0.7% | 34.0% | 58.2% | 7.0% |
| With disabilities | 1.9% | 20.3% | 70.0% | 7.8% | |
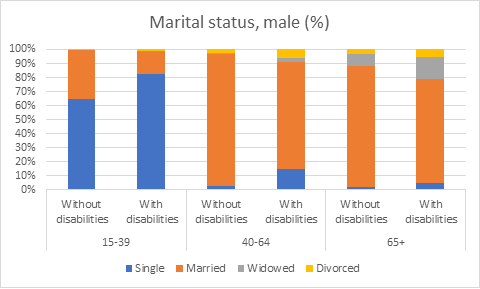
| Single | Married | Widowed | Divorced | ||
|---|---|---|---|---|---|
| 15-39 | Without disabilities | 64.3% | 35.1% | 0.0% | 0.5% |
| With disabilities | 82.6% | 16.1% | 0.1% | 1.2% | |
| 40-64 | Without disabilities | 2.9% | 93.8% | 1.0% | 2.2% |
| With disabilities | 14.8% | 76.2% | 3.2% | 5.8% | |
| 65+ | Without disabilities | 1.9% | 86.3% | 8.2% | 3.5% |
| With disabilities | 4.8% | 74.4% | 15.6% | 5.2% | |
Cause of disability (%)
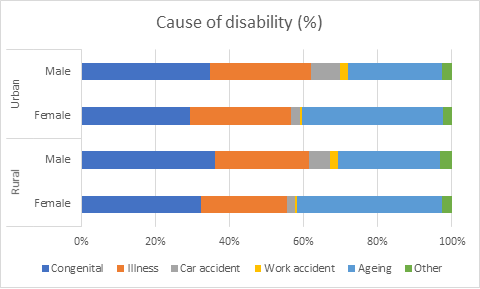
| Congenital | Illness | Car accident | Work accident | Ageing | Other | ||
|---|---|---|---|---|---|---|---|
| Rural | Female | 32.2% | 23.2% | 2.3% | 0.5% | 39.2% | 2.7% |
| Male | 36.2% | 25.2% | 5.7% | 2.2% | 27.5% | 3.2% | |
| Urban | Female | 29.3% | 27.3% | 2.4% | 0.5% | 38.2% | 2.4% |
| Male | 34.7% | 27.3% | 7.8% | 2.3% | 25.3% | 2.7% | |
By literacy status age: 15+ years
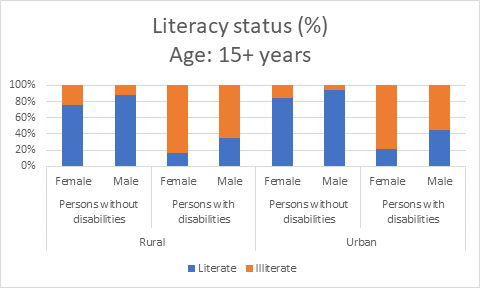
| Literate | Illiterate | |||
|---|---|---|---|---|
| Rural | Persons without disabilities | Female | 75.6% | 24.4% |
| Male | 88.0% | 12.0% | ||
| Persons with disabilities | Female | 15.9% | 84.1% | |
| Male | 34.7% | 65.3% | ||
| Urban | Persons without disabilities | Female | 84.3% | 15.7% |
| Male | 93.8% | 6.2% | ||
| Persons with disabilities | Female | 21.6% | 78.4% | |
| Male | 44.3% | 55.7% | ||
By school attendance
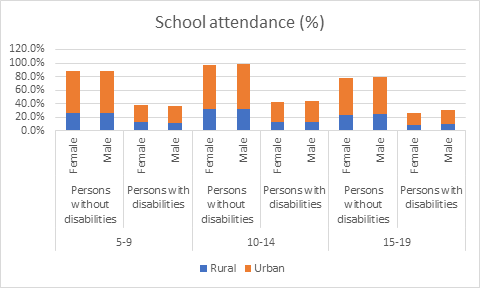
| Rural | Urban | Total | |||
|---|---|---|---|---|---|
| 5-9 | Persons without disabilities | Female | 26.0% | 61.5% | 87.5% |
| Male | 26.1% | 61.5% | 87.6% | ||
| Persons with disabilities | Female | 13.2% | 25.0% | 38.2% | |
| Male | 11.6% | 24.7% | 36.3% | ||
| 10-14 | Persons without disabilities | Female | 31.7% | 66.0% | 97.7% |
| Male | 31.7% | 66.2% | 98.0% | ||
| Persons with disabilities | Female | 13.6% | 28.3% | 41.9% | |
| Male | 12.8% | 31.0% | 43.8% | ||
| 15-19 | Persons without disabilities | Female | 23.8% | 53.4% | 77.3% |
| Male | 24.5% | 54.5% | 79.0% | ||
| Persons with disabilities | Female | 9.3% | 17.3% | 26.6% | |
| Male | 9.6% | 21.0% | 30.6% | ||
By educational attainment age: 10+ years
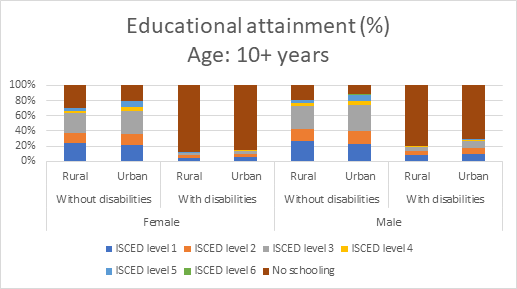
| ISCED level 1 | ISCED level 2 | ISCED level 3 | ISCED level 4 | ISCED level 5 | ISCED level 6 | No schooling | |||
|---|---|---|---|---|---|---|---|---|---|
| Female | Without disabilities | Rural | 24.0% | 13.4% | 25.9% | 3.0% | 4.2% | 0.1% | 29.5% |
| Urban | 21.3% | 13.9% | 30.6% | 5.9% | 7.6% | 0.5% | 20.2% | ||
| With disabilities | Rural | 4.8% | 2.9% | 3.2% | 0.3% | 0.4% | 0.0% | 88.4% | |
| Urban | 5.6% | 3.6% | 4.4% | 0.7% | 0.5% | 0.1% | 85.2% | ||
| Male | Without disabilities | Rural | 26.0% | 16.9% | 30.0% | 3.4% | 4.2% | 0.4% | 19.0% |
| Urban | 23.1% | 17.4% | 33.5% | 5.8% | 6.9% | 1.4% | 12.0% | ||
| With disabilities | Rural | 8.1% | 5.1% | 5.7% | 0.5% | 0.4% | 0.1% | 80.1% | |
| Urban | 10.0% | 7.7% | 8.5% | 1.3% | 1.1% | 0.2% | 71.2% | ||
Note: Data source includes a more detailed breakdown for “no schooling” (by illiterate and can read/write) and ISCED levels 1 (by primary and basic education/first loop), 2 (by preparatory and basic education/second loop), 3 (by secondary and general certificate diploma) and 6 (by master’s degree and PhD).
By economic activity age: 15–64 years
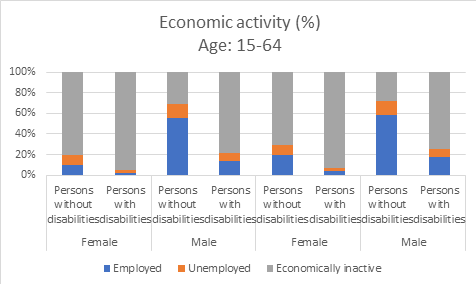
| Employed | Unemployed | Economically inactive | |||
|---|---|---|---|---|---|
| Rural | Female | Persons without disabilities | 9.7% | 10.0% | 80.3% |
| Persons with disabilities | 2.4% | 2.1% | 95.4% | ||
| Male | Persons without disabilities | 55.1% | 14.5% | 30.5% | |
| Persons with disabilities | 13.8% | 7.6% | 78.7% | ||
| Urban |
Female | Persons without disabilities | 19.2% | 10.5% | 70.3% |
| Persons with disabilities | 4.0% | 2.5% | 93.6% | ||
| Male | Persons without disabilities | 58.6% | 13.6% | 27.8% | |
| Persons with disabilities | 17.4% | 7.6% | 74.9% | ||
By sector of employment
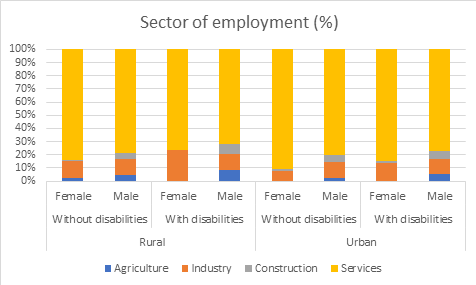
| Agriculture | Industry | Construction | Services | |||
|---|---|---|---|---|---|---|
| Rural | Without disabilities | Female | 2.3% | 13.1% | 0.6% | 84.0% |
| Male | 4.9% | 11.5% | 5.0% | 78.5% | ||
| With disabilities | Female | 0.0% | 23.9% | 0.0% | 76.1% | |
| Male | 8.3% | 12.5% | 7.3% | 71.9% | ||
| Urban | Without disabilities | Female | 0.3% | 7.6% | 1.6% | 90.5% |
| Male | 2.4% | 12.0% | 5.3% | 80.3% | ||
| With disabilities | Female | 0.0% | 13.8% | 1.6% | 84.6% | |
| Male | 5.2% | 11.3% | 6.0% | 77.5% | ||