Table of contents:
Breaking the Cycle of Exclusion: Access to Employment and Education
Poverty and disability are often inextricably linked to form a mutually reinforcing cycle of vulnerability. People living in poverty are more likely to have or to incur disabilities as they have limited access to quality health care and are more exposed to risk factors such as malnutrition and poor sanitation. At the same time, persons with disabilities often face substantial barriers in finding employment and accessing education, which in turn increases their vulnerability.
While data on income levels among persons with disabilities is scant in the region, available data on economic activity and educational attainment can provide important insight into the scale of deprivation experienced by persons with disabilities in Arab countries. Moreover, it is crucial to study these trends as access to employment and education also represent fundamental human rights, which are key to enabling equal participation of persons with disabilities in social and economic life.
It is clear that governments have made significant steps to develop their legislative frameworks regarding access to labour markets and education. National laws on employment for persons with disabilities, for example, are prevalent throughout the Arab region and are reported in a vast majority of countries. In addition, a large number of Arab countries have also instituted employment quotas for persons with disabilities, mainly in the public sector, but also, increasingly, in the private sector (see table 4).
| Country | National employment quota for persons with disabilities | Source |
|---|---|---|
| Algeria | One per cent for each employer | Law No. 02-09 on the Protection and Promotion of Persons with Disabilities (2002), Chapter 3, Article 27 |
| Bahrain | Two per cent for employers that employ 50 people or morea | Law No. 74 on the Welfare, Rehabilitation and Employment of Persons with Disabilities (2006), Article 11 |
| Comoros | .. | .. |
| Djibouti | .. | .. |
| Egypt | Five per cent for employers that employ 50 people or more | Law No. 39 on the Rehabilitation of Disabled Persons (1975), amended by Law No. 49 (1982), Chapter 1, Article 9 |
| Iraq | Five per cent for the public sector; one person with disability/ies for mixed sector companies that employ 30 to 60 people; at least three per cent for mixed sector companies that employ over 60 people | Law No. 38 on the Welfare of Persons with Disabilities and Special Needs (2013), Article 16 |
| Jordan | One person with disability/ies for public and private entities that employ between 25 and 50 people; four per cent for public and private entities that employ more than 50 people | Law No. 31 on the Rights of Disabled Persons (2007), Article 4/3 |
| Kuwait | Four per cent of all Kuwaiti national employees for public, private and oil entities that employ at least 50 Kuwaiti nationals | Law No. 8 on the Rights of Persons with Disabilities (2010), Chapter 4, Article 14 |
| Lebanon | Three per cent for the public sector; one person with disability/ies for private companies that employ 30 to 60 people; three per cent for private companies that employ over 60 people | Law No. 220 on the Rights of Persons with Disabilities (2000), Section 8, Articles 73-74 |
| Libya | .. | .. |
| Mauritania | .. | .. |
| Morocco | Seven per cent for the public sector | Prime Ministerial Decision No. 3.130.00 on Determining the Number of Posts Allocated to Disabled Persons and the Percentage of those Posts in State Departments and other Relevant Bodies (2000), Article 2 |
| Oman | No specific quota is defined, but the law stipulates that public and private companies that employ 50 people or more must allocate a percentage of posts to persons with disabilities, which is determined according to the number of vacant posts | Sultanate Decree No. 63 on the Law on Care and Rehabilitation of the Disabled (2008), Section 2, Article 9; Sultanate Decree No. 35 on the Labour Law (2003), Article 17 |
| Palestine | Five per cent for government and non-government organizations | Law No. 4 Concerning the Rights of the Disabled (1999), Chapter 2, Article 10, 4c |
| Qatar | At least two per cent for the public sector; at least two per cent with a minimum of one person with disability/ies for private sector employers that employ 25 people or moreb | Law No. 2 on Persons with Disabilities (2004), Article 5 |
| Saudi Arabia | Four per cent for companies that employ 25 people or more | Royal Decree No. M/51, Labour Law (2005) Section 2, Chapter 2, Article 28 |
| Somalia | .. | .. |
| Sudan | Two per cent for government entities | National Civil Service Law (2007), Section 4, Article 24/7 |
| Syrian Arab Republic | Two per cent for the public sector | Labour Law No. 17 (2010), Article 136 |
| Tunisia | One per cent of posts for the public sector; one per cent for public and private institutions that employ 100 people or more | Directive No. 83 on the Advancement and Protection of Persons with Disabilities (2005), Articles 29-30 |
| United Arab Emirates | No specific quota is defined, but the law stipulates that a number of posts are reserved for the disabled in the civil service, which is determined by the Civil Service Boardc | Civil Service Law No. 21 (2001) |
| Yemen | Five per cent of total vacancies in public and private sectors | Prime Ministerial Decision No. 284 (2002) on the Executive Rules of Law No. 61 on the Care and Rehabilitation of the Disabled (1999) |
Source: ESCWA, based on data collected from government focal points through the ESCWA Questionnaire on the Implementation of the Convention on the Rights of Persons with Disabilities and the Arab Decade for Persons with Disabilities (2013).
Notes: a according to the questionnaire response from the government focal point, this quota will be replaced by other measures; b according to the questionnaire response from the government focal point, a new quota is currently being developed; c according to the questionnaire response from the government focal point, the Emirate of Abu Dhabi has introduced a 2 per cent quota for local public institutions.
However, when looking at the impact of these institutional and legal reforms on economic activity and employment rates, the picture becomes far more mixed.
High disparities in economic activity and employment rates can be found when comparing data on persons with disabilities with data on total populations (see figure 2). In almost all countries where data is readily available, persons with disabilities report substantially lower levels of employment than their peers without disabilities. In some cases, employment rates for persons with disabilities are half or even one third that of the total population. Good practices in other countries demonstrate that these rates are far from what is achievable; Germany, Iceland, Luxembourg, Mexico and Sweden report employment rates for persons with disabilities of at least two thirds that of their total populations.
“States Parties recognize the right of persons with disabilities to work, on an equal basis with others; this includes the right to the opportunity to gain a living by work freely chosen or accepted in a labour market and work environment that is open, inclusive and accessible to persons with disabilities.”
UN Convention on the Rights of Persons with Disabilities (Article 27, paragraph 1)
The trends found in Arab countries concur with findings in scholarly research from other regions. A recent study by the Organization for Economic Co-operation and Development (OECD) finds that employment rates are significantly lower for persons with disabilities than for the total population in a number of OECD countries such as Ireland, Poland and the United States of America, and that these employment gaps tend to be higher for persons with certain types of disabilities, such as those with mental health conditions. Another study of employment rates for persons with disabilities in 15 developing countries comes to similar conclusions. More specifically, it finds that employment rates are significantly lower for persons with disabilities in nine countries, with the largest gaps being reported for persons with multiple disabilities.
Figure 2 Distribution of persons with disabilities and total population (15 years and above) by economic activity for selected Arab countries
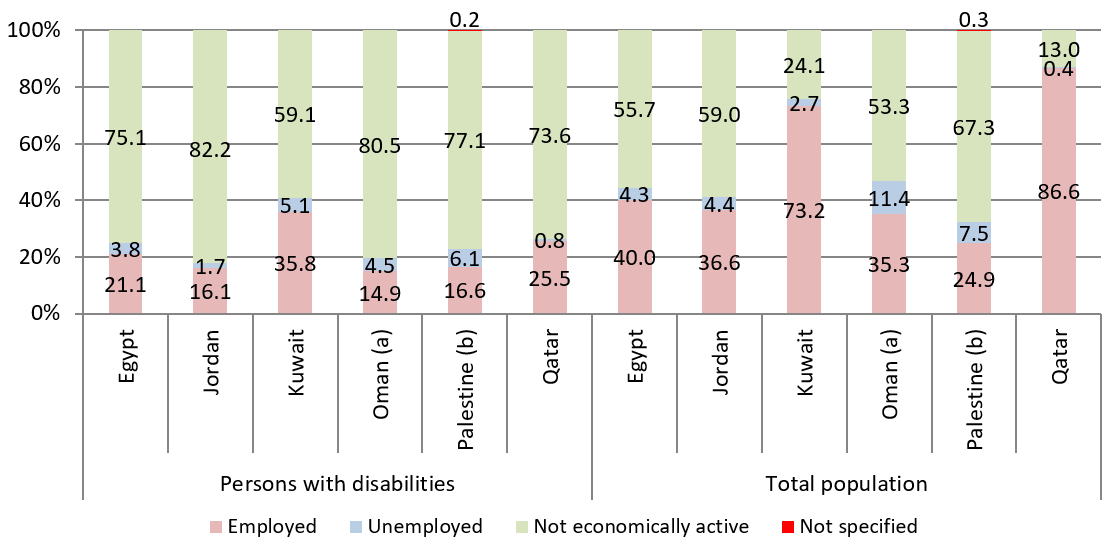
Sources: ESCWA, based on data verified by national statistical offices from the following sources: Egypt: Central Agency for Public Mobilization and Statistics (2006); Jordan: Department of Statistics (2010); Kuwait: Central Statistical Bureau (2011); Oman: National Center for Statistics and Information (2010); Palestine: Palestinian Central Bureau of Statistics (2007); Qatar: Qatar Statistics Authority (2010).
Notes: a data pertains to nationals only; b data pertains to persons aged 10 years and above.
Similarly, while laws and regulations on education for persons with disabilities are widespread in the Arab region, available data suggests that these frameworks have limited impact on the ground. For those Arab countries where comparable data on educational attainment is available, the proportion of persons who are considered illiterate is substantially higher for persons with disabilities than for total populations (see figure 3). Moreover, educational attainment rates, especially at secondary and tertiary levels, tend to be significantly lower for persons with disabilities than for total populations.
“States Parties shall ensure that …[p]ersons with disabilities are not excluded from the general education system on the basis of disability, and that children with disabilities are not excluded from free and compulsory primary education, or from secondary education, on the basis of disability”.
UN Convention on the Rights of Persons with Disabilities (Article 24, paragraph 2)
These trends in educational attainment data also accord with previous findings by scholars and international organizations. In its research on the Middle East and North Africa, for example, the World Bank finds that education systems “continue to exclude the majority of the disabled school-aged population at the primary level and almost the entirety of this population at the university level”. Similarly, the United Nations Children’s Fund (UNICEF) concludes that although in principle all children have the same right to an education, children with disabilities are often denied this right in practice.
Figure 3 Differentials in illiteracy for persons with disabilities and total populations (10 years and above) according to educational attainment data for selected Arab countries
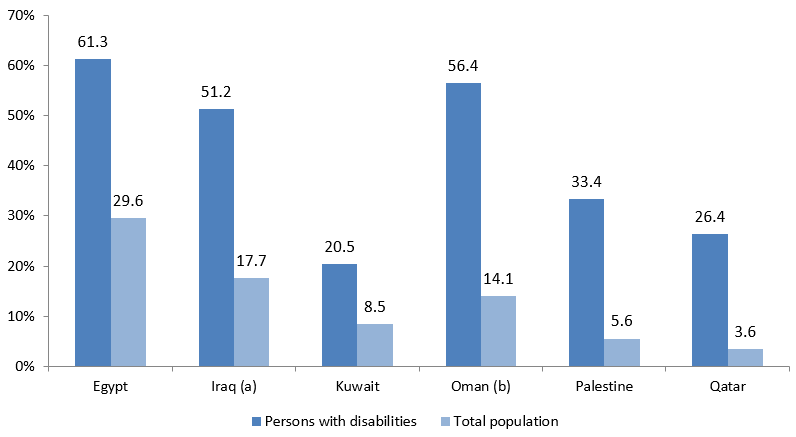
Sources: ESCWA, based on data verified by national statistical offices from the following sources: Egypt: Central Agency for Public Mobilization and Statistics (2006); Iraq: Central Organization for Statistics and Information Technology et al. (2007); Kuwait: Central Statistical Bureau (2011); Oman: National Center for Statistics and Information (2010); Palestine: Palestinian Central Bureau of Statistics (2007); Qatar: Qatar Statistics Authority (2010).
Notes: a percentages for Iraq are calculated as follows: for persons with disabilities - total number of persons with disabilities (6 years and above) classified as illiterate divided by the total number of persons with disabilities (all ages); for total population - total number of persons (6 years and above) classified as illiterate divided by the total population (all ages); and b data pertains to nationals only and to persons aged 15 years and above.
Gender gaps are very visible in the available data on economic activity and educational attainment. Table 5 presents employment rates for persons with disabilities and total populations disaggregated by sex for those Arab countries where comparable data is available. According to this table, gender gaps in employment rates exist both for persons with disabilities and total populations. The magnitude of this gap varies among countries, with some reporting employment rates that are three to four times higher for men than for women.
| Country | Persons with disabilities (in percentage) | Total population (in percentage) | ||
|---|---|---|---|---|
| Female | Male | Female | Male | |
| Egypt | 7.5 | 28.4 | 12.9 | 66.1 |
| Kuwait | 21.6 | 45.4 | 58.1 | 84.0 |
| Omana | 4.8 | 23.7 | 15.5 | 54.7 |
| Palestineb | 3.6 | 28.7 | 7.1 | 42.4 |
| Qatar | 8.1 | 38.9 | 50.8 | 95.8 |
Sources: ESCWA, based on data verified by national statistical offices from the following sources: Egypt: Central Agency for Public Mobilization and Statistics (2006); Kuwait: Central Statistical Bureau (2011); Oman: National Center for Statistics and Information (2010); Palestine: Palestinian Central Bureau of Statistics (2007); Qatar: Qatar Statistics Authority (2010).
Notes: a data pertains to nationals only; b data pertains to persons aged 10 years and above.
Since employment rates for women are also rather low among total populations, the additional disadvantage experienced by women as a result of their disability/ies can be visualized by calculating employment ratios. Employment ratios for the same five countries are presented in figure 4. Employment ratios are a helpful tool for exploring the extent to which persons with disabilities are integrated into the labour market relative to total populations. The ratios below have been calculated for persons with disabilities by dividing the employment rate of women with disabilities by that of men with disabilities. Similarly for the total population, the ratios have been calculated by dividing the overall employment rate for women by the overall employment rate for men. A ratio close to one indicates that there is relative parity between men and women in accessing employment, while a ratio close to zero suggests that women have very limited access to employment opportunities relative to men.
For four out of the five countries presented, employment ratios are lower for persons with disabilities than for total populations. In other words, the data for Kuwait, Oman, Palestine and Qatar suggests that the gender gap in employment rates is higher for persons with disabilities relative to the total population. The data for Egypt indicates an opposing trend, whereby the gender gap appears to be slightly lower for persons with disabilities than for the total population.
Figure 4 Employment ratios for persons with disabilities and total populations (15 years and above) for selected Arab countries
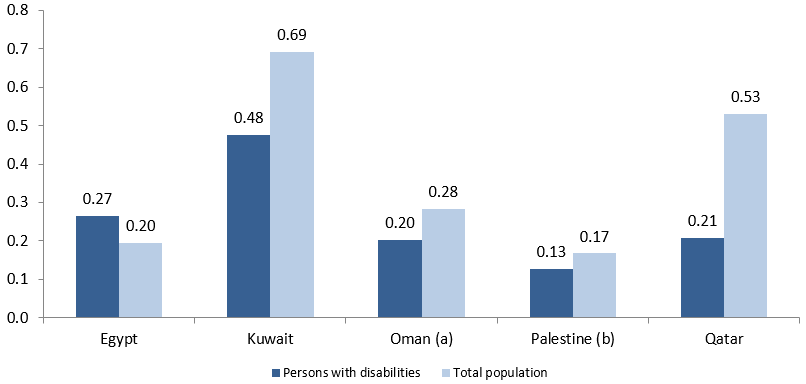
Sources: ESCWA, based on data verified by national statistical offices from the following sources: Egypt: Central Agency for Public Mobilization and Statistics (2006); Kuwait: Central Statistical Bureau (2011); Oman: National Center for Statistics and Information (2010); Palestine: Palestinian Central Bureau of Statistics (2007); Qatar: Qatar Statistics Authority (2010).
Notes: a data pertains to nationals only; b data pertains to persons aged 10 years and above.
In sum, the data presented above suggests that, despite enabling legislation, persons with disabilities in the Arab region experience more limited access to employment opportunities and quality education than their peers without disabilities. It is particularly noteworthy that while employment quotas are widespread in the Arab region, employment rates of persons with disabilities remain remarkably low in comparison to total populations. Moreover, certain groups, such as women with disabilities, appear to face additional barriers, especially in accessing employment. However, further research and disaggregated data, especially by age (given its impact on economic activity rates) but also other factors such as geographical location, are needed in order to derive more detailed policy recommendations from these observations.