جدول المحتويات:
البحرين 2014
Source: Calculated from ESCWA, 2017a, based on data provided by the NSO from the Bahrain census 2010, unless otherwise indicated
Population
Total female population: 466,157 (37.76%)
Total male population: 768,414 (62.24%)
Total population: 1,234,571
Total female persons with disabilities: 11,091 (37.35%)
Total male persons with disabilities: 18,601 (62.65%)
Total persons with disabilities: 29,692
Disability prevalence (%)
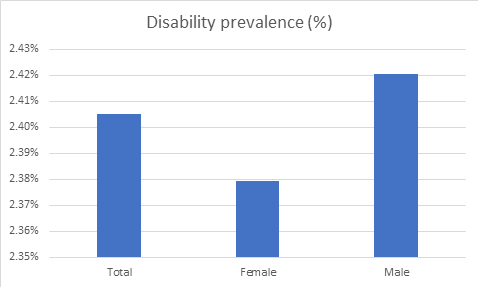
| Total | 2.41% |
|---|---|
| Female | 2.38% |
| Male | 2.42% |
Age-specific disability prevalence (%)
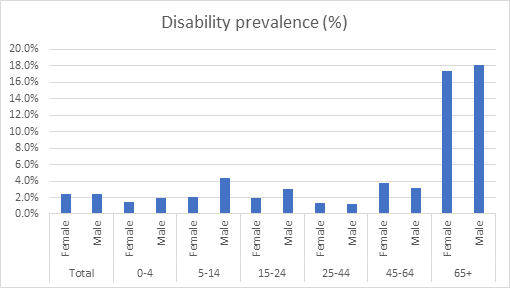
| Total | Female | 2.4% |
|---|---|---|
| Male | 2.4% | |
| 0-4 | Female | 1.4% |
| Male | 2.0% | |
| 5-14 | Female | 2.1% |
| Male | 4.4% | |
| 15-24 | Female | 1.9% |
| Male | 3.0% | |
| 25-44 | Female | 1.3% |
| Male | 1.2% | |
| 45-64 | Female | 3.7% |
| Male | 3.1% | |
| 65+ | Female | 17.4% |
| Male | 18.2% |
Age distribution (%)
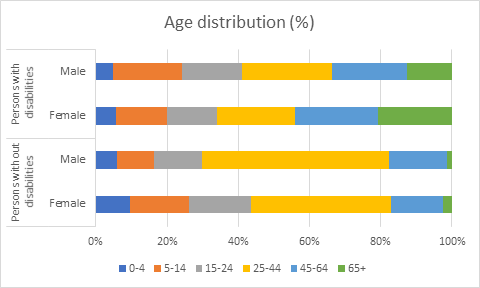
| 0-4 | 5-14 | 15-24 | 25-44 | 45-64 | 65+ | ||
|---|---|---|---|---|---|---|---|
| Persons without disabilities | Female | 9.5% | 16.6% | 17.5% | 39.3% | 14.6% | 2.4% |
| Male | 5.9% | 10.4% | 13.4% | 52.7% | 16.1% | 1.4% | |
| Persons with disabilities | Female | 5.5% | 14.4% | 14.2% | 21.9% | 23.1% | 20.9% |
| Male | 4.8% | 19.4% | 16.7% | 25.5% | 21.0% | 12.6% | |
Type of disability/difficulty (%)
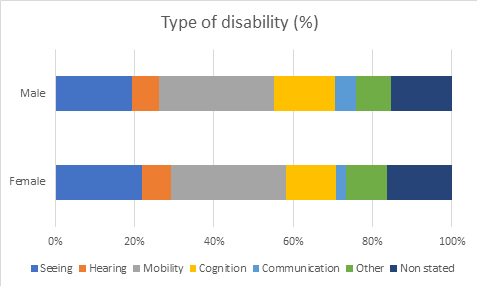
| Seeing | Hearing | Mobility | Cognition | Communication | Other | Non stated | |
|---|---|---|---|---|---|---|---|
| Female | 21.8% | 7.5% | 28.9% | 12.6% | 2.5% | 10.4% | 16.4% |
| Male | 19.4% | 6.9% | 28.9% | 15.3% | 5.4% | 8.9% | 15.2% |
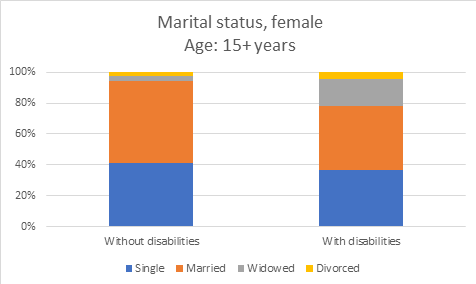
| Single | Married | Widowed | Divorced | |
|---|---|---|---|---|
| Without disabilities | 41.0% | 53.4% | 3.4% | 2.2% |
| With disabilities | 36.6% | 41.5% | 17.5% | 4.3% |
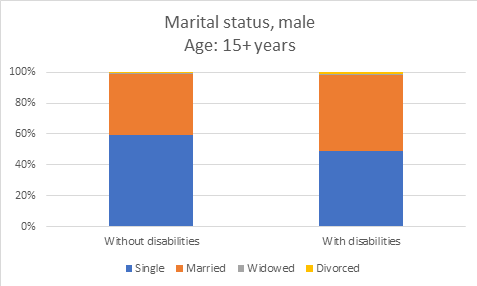
| Single | Married | Widowed | Divorced | |
|---|---|---|---|---|
| Without disabilities | 59.6% | 39.6% | 0.2% | 0.7% |
| With disabilities | 49.2% | 49.1% | 0.6% | 1.2% |
Note: Age disaggregation is not available
Cause of disability (%)
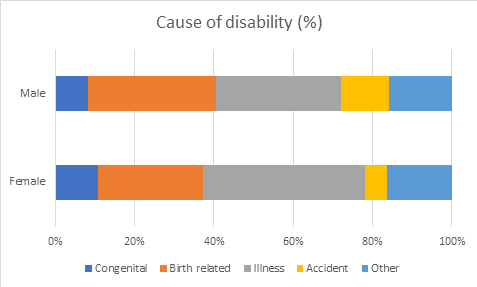
| Congenital | Birth-related | Illness | Accident | Other | |
|---|---|---|---|---|---|
| Female | 10.7% | 26.4% | 41.0% | 5.4% | 16.5% |
| Male | 8.3% | 32.1% | 31.7% | 12.1% | 15.8% |
By literacy status age: 15+ years
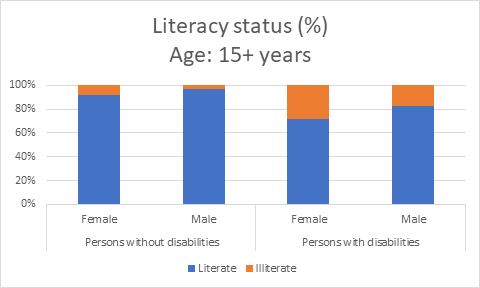
| Literate | Illiterate | ||
|---|---|---|---|
| Persons without disabilities | Female | 92.1% | 7.9% |
| Male | 96.4% | 3.6% | |
| Persons with disabilities | Female | 71.6% | 28.4% |
| Male | 82.4% | 17.6% | |
By school attendance
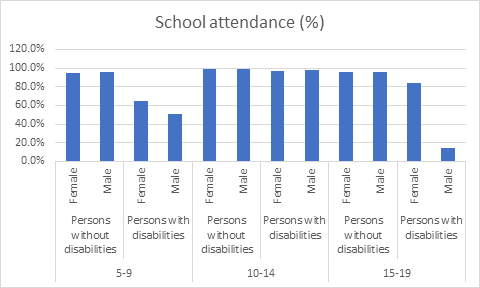
| 5-9 | Persons without disabilities | Female | 94.8% |
|---|---|---|---|
| Male | 95.5% | ||
| Persons with disabilities | Female | 64.4% | |
| Male | 51.2% | ||
| 10-14 | Persons without disabilities | Female | 99.2% |
| Male | 99.0% | ||
| Persons with disabilities | Female | 97.3% | |
| Male | 98.5% | ||
| 15-19 | Persons without disabilities | Female | 95.9% |
| Male | 95.9% | ||
| Persons with disabilities | Female | 83.9% | |
| Male | 14.5% |
By educational attainment age: 5+ years
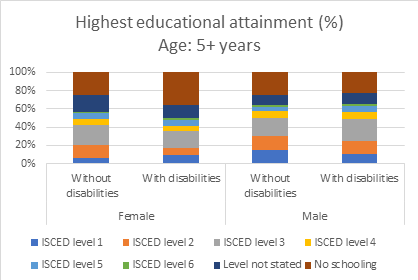
| ISCED level 1 | ISCED level 2 | ISCED level 3 | ISCED level 4 | ISCED level 5 | ISCED level 6 | Level not stated | No schooling | ||
|---|---|---|---|---|---|---|---|---|---|
| Female | Without disabilities | 6.6% | 14.1% | 21.1% | 7.4% | 6.0% | 1.4% | 18.4% | 25.0% |
| With disabilities | 9.2% | 8.0% | 18.0% | 6.2% | 6.0% | 2.4% | 14.9% | 35.4% | |
| Male | Without disabilities | 14.4% | 15.6% | 19.7% | 7.4% | 5.0% | 1.9% | 11.2% | 24.8% |
| With disabilities | 11.0% | 13.6% | 24.1% | 7.3% | 7.1% | 2.1% | 12.5% | 22.3% | |
Note: Data source includes a more detailed breakdown for ISCED level 6 (by high diploma, master’s degree and doctorate) and “level not stated” (by age group).
By marital status by age group
| Single | Married | Widowed | Divorced | |
|---|---|---|---|---|
| Without disabilities | 41.0% | 53.4% | 3.4% | 2.2% |
| With disabilities | 36.6% | 41.5% | 17.5% | 4.3% |
| Single | Married | Widowed | Divorced | |
|---|---|---|---|---|
| Without disabilities | 59.6% | 39.6% | 0.2% | 0.7% |
| With disabilities | 49.2% | 49.1% | 0.6% | 1.2% |
Note: Age disaggregation is not available
By economic activity age: 15+ years
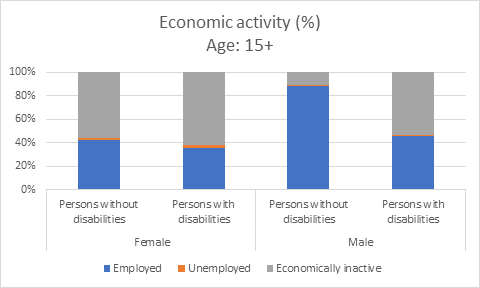
| Employed | Unemployed | Economically inactive | ||
|---|---|---|---|---|
| Female | Persons without disabilities | 42.2% | 1.6% | 56.2% |
| Persons with disabilities | 35.1% | 3.3% | 61.6% | |
| Male | Persons without disabilities | 88.4% | 0.4% | 11.3% |
| Persons with disabilities | 45.6% | 0.6% | 53.9% | |
Note: Disaggregation by age is not possible due to limited data.
By sector of employment
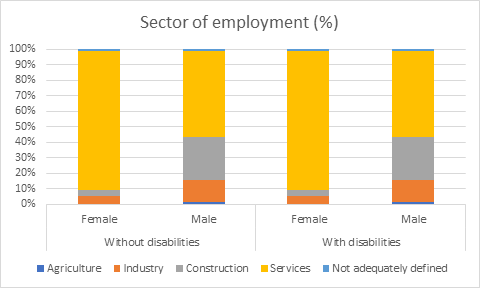
| Agriculture | Industry | Construction | Services | Not adequately defined | ||
|---|---|---|---|---|---|---|
| Without disabilities | Female | 0.05% | 5.06% | 3.90% | 89.75% | 1.24% |
| Male | 1.34% | 14.32% | 27.79% | 55.27% | 1.28% | |
| With disabilities | Female | 0.06% | 5.07% | 3.90% | 89.76% | 1.22% |
| Male | 1.34% | 14.33% | 27.79% | 55.26% | 1.28% | |