جدول المحتويات:
الأردن 2015
Source: Calculated from ESCWA, 2017a, based on data provided by the NSO from the Jordan census 2015, unless otherwise indicated
Population
Total female population: 4,637,020 (47.57%)
Total male population: 4,813,509 (52.43)
Total population: 9,180,529
Total female persons with disabilities: 116,682 (46.39%)
Total male persons with disabilities: 134,817 (53.61%)
Total persons with disabilities: 251,499
Disability prevalence (%)
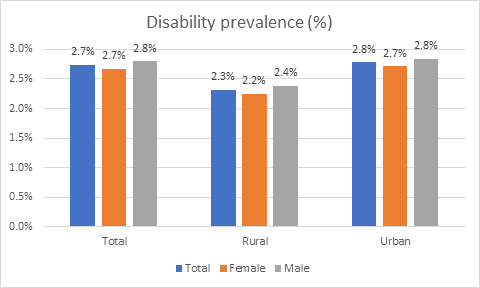
| Total | Rural | Urban | |
|---|---|---|---|
| Total | 2.74% | 2.32% | 2.78% |
| Female | 2.67% | 2.24% | 2.72% |
| Male | 2.80% | 2.39% | 2.84% |
Note: The data pertain only to persons aged 5 and above.
Age-specific disability prevalence (%)
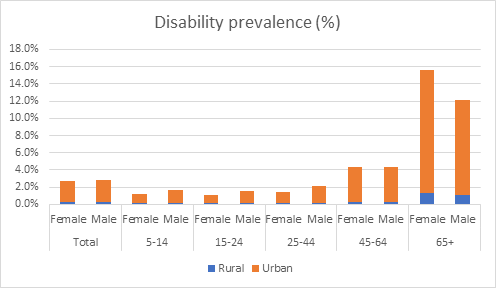
| Rural | Urban | Total | ||
|---|---|---|---|---|
| Total | Female | 0.2% | 2.5% | 2.7% |
| Male | 0.2% | 2.6% | 2.8% | |
| 5-14 | Female | 0.1% | 1.1% | 1.2% |
| Male | 0.1% | 1.5% | 1.6% | |
| 15-24 | Female | 0.1% | 1.0% | 1.1% |
| Male | 0.1% | 1.4% | 1.6% | |
| 25-44 | Female | 0.1% | 1.3% | 1.4% |
| Male | 0.2% | 2.0% | 2.1% | |
| 45-64 | Female | 0.3% | 4.0% | 4.3% |
| Male | 0.3% | 4.0% | 4.3% | |
| 65+ | Female | 1.3% | 14.3% | 15.6% |
| Male | 1.0% | 11.1% | 12.2% | |
Age distribution (%)
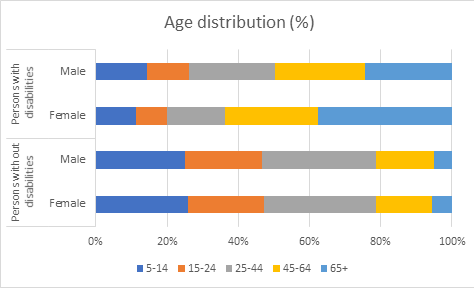
| 5-14 | 15-24 | 25-44 | 45-64 | 65+ | ||
|---|---|---|---|---|---|---|
| Persons without disabilities | Female | 26.0% | 21.4% | 31.3% | 15.8% | 5.6% |
| Male | 24.9% | 21.8% | 32.1% | 16.1% | 5.1% | |
| Persons with disabilities | Female | 11.2% | 8.7% | 16.5% | 26.1% | 37.5% |
| Male | 14.3% | 11.9% | 24.2% | 25.0% | 24.5% | |
Type of disability/difficulty (%)
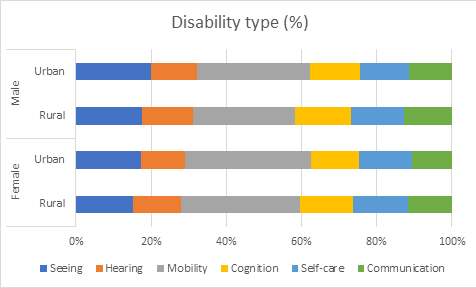
| Seeing | Hearing | Mobility | Cognition | Self-care | Communication | ||
|---|---|---|---|---|---|---|---|
| Female | Rural | 15.1% | 12.8% | 31.8% | 14.0% | 14.6% | 11.7% |
| Urban | 17.4% | 11.7% | 33.4% | 12.9% | 14.2% | 10.5% | |
| Male | Rural | 17.6% | 13.5% | 27.3% | 14.8% | 14.0% | 12.8% |
| Urban | 20.0% | 12.3% | 29.9% | 13.3% | 13.1% | 11.4% | |
Note: Persons may report more than one type of disability.
By marital status by age group
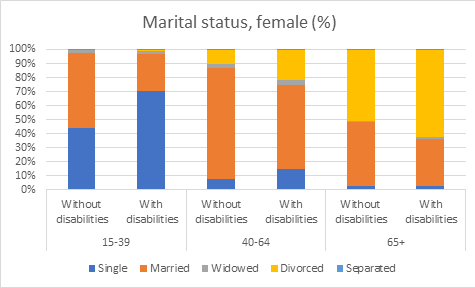
| Single | Married | Widowed | Divorced | Separated | ||
|---|---|---|---|---|---|---|
| 15-39 | Without disabilities | 44.1% | 53.6% | 1.5% | 0.6% | 0.1% |
| With disabilities | 70.2% | 26.6% | 2.1% | 1.0% | 0.2% | |
| 40-64 | Without disabilities | 7.8% | 78.9% | 2.7% | 10.3% | 0.4% |
| With disabilities | 14.7% | 59.7% | 3.6% | 21.4% | 0.6% | |
| 65+ | Without disabilities | 2.8% | 45.1% | 1.3% | 50.5% | 0.3% |
| With disabilities | 2.3% | 34.0% | 1.3% | 62.1% | 0.3% | |
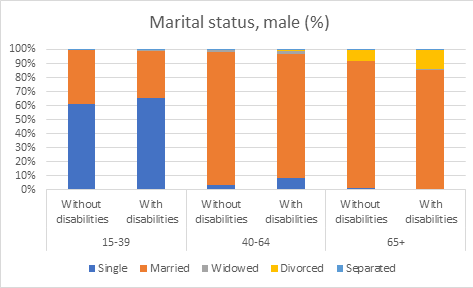
| Single | Married | Widowed | Divorced | Separated | ||
|---|---|---|---|---|---|---|
| 15-39 | Without disabilities | 60.9% | 38.5% | 0.5% | 0.0% | 0.0% |
| With disabilities | 65.2% | 33.7% | 1.0% | 0.1% | 0.1% | |
| 40-64 | Without disabilities | 3.6% | 94.9% | 0.9% | 0.6% | 0.1% |
| With disabilities | 8.3% | 88.8% | 1.5% | 1.2% | 0.2% | |
| 65+ | Without disabilities | 0.9% | 90.6% | 0.6% | 7.8% | 0.1% |
| With disabilities | 0.8% | 84.8% | 0.7% | 13.4% | 0.3% | |
By literacy status age: 15+ years
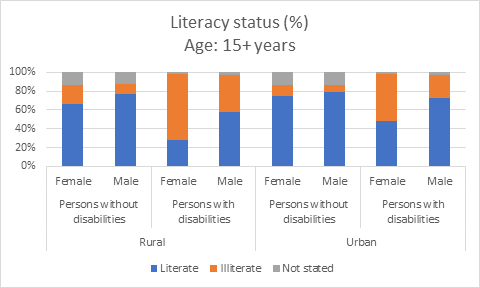
| Literate | Illiterate | Not stated | |||
|---|---|---|---|---|---|
| Rural | Persons without disabilities | Female | 66.7% | 19.2% | 14.1% |
| Male | 76.5% | 11.4% | 12.0% | ||
| Persons with disabilities | Female | 28.5% | 69.6% | 1.9% | |
| Male | 57.3% | 40.0% | 2.7% | ||
| Urban | Persons without disabilities | Female | 74.6% | 11.5% | 13.9% |
| Male | 79.3% | 7.5% | 13.1% | ||
| Persons with disabilities | Female | 48.0% | 49.8% | 2.2% | |
| Male | 72.6% | 24.8% | 2.6% | ||
By educational attainment age: 13+ years
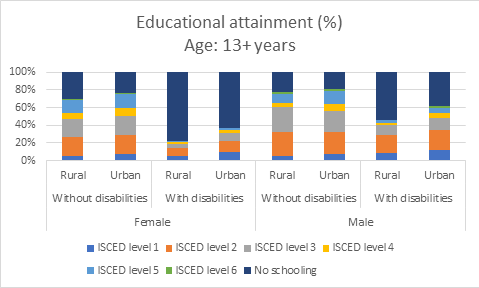
| ISCED level 1 | ISCED level 2 | ISCED level 3 | ISCED level 4 | ISCED level 5 | ISCED level 6 | No schooling | |||
|---|---|---|---|---|---|---|---|---|---|
| Female | Without disabilities | Rural | 5.1% | 21.2% | 20.7% | 6.9% | 14.6% | 1.1% | 30.4% |
| Urban | 6.9% | 22.1% | 21.2% | 9.7% | 15.2% | 1.6% | 23.2% | ||
| With disabilities | Rural | 5.0% | 8.7% | 5.5% | 1.4% | 1.2% | 0.2% | 78.0% | |
| Urban | 9.7% | 13.0% | 8.4% | 3.3% | 2.6% | 0.4% | 62.7% | ||
| Male | Without disabilities | Rural | 5.2% | 27.2% | 27.9% | 4.7% | 10.4% | 1.7% | 22.8% |
| Urban | 7.0% | 25.7% | 22.8% | 8.4% | 14.5% | 2.7% | 18.9% | ||
| With disabilities | Rural | 9.0% | 19.9% | 11.7% | 2.4% | 2.7% | 0.7% | 53.7% | |
| Urban | 12.5% | 22.4% | 13.8% | 4.8% | 6.3% | 1.4% | 38.8% | ||
Note: Data source includes a more detailed breakdown for ISCED levels 2 (by general and lower secondary) and 3 (by upper secondary and technical/vocational).
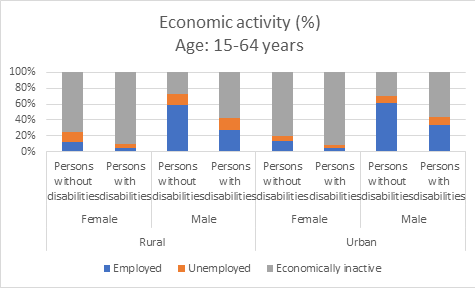
By economic activity age: 15–64 years
| Employed | Unemployed | Economically inactive | |||
|---|---|---|---|---|---|
| Rural | Female | Persons without disabilities | 12.7% | 12.7% | 74.6% |
| Persons with disabilities | 4.7% | 5.5% | 89.8% | ||
| Male | Persons without disabilities | 59.4% | 12.6% | 28.0% | |
| Persons with disabilities | 27.8% | 14.3% | 57.9% | ||
| Urban | Female | Persons without disabilities | 13.6% | 6.3% | 80.1% |
| Persons with disabilities | 5.3% | 3.5% | 91.2% | ||
| Male | Persons without disabilities | 61.6% | 8.7% | 29.7% | |
| Persons with disabilities | 33.2% | 10.6% | 56.2% | ||