جدول المحتويات:
اليمن 2014
Source: Calculated from ESCWA, 2017a, based on data provided by the NSO from the Yemen Household Budget Survey 2014, unless otherwise indicated
Population
Total female population: 13,147,434 (50.58%)
Total male population: 12,846,022 (49.42%%)
Total population: 25,993,456
Total female persons with disabilities: 265,509 (47.02%)
Total male persons with disabilities: 299,185 (52.98%)
Total persons with disabilities: 564,694
Disability prevalence (%)
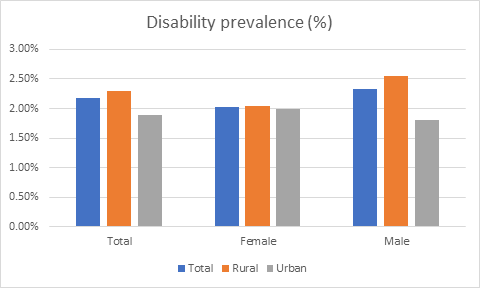
| Total | Rural | Urban | |
|---|---|---|---|
| Total | 2.17% | 2.29% | 1.90% |
| Female | 2.02% | 2.04% | 1.98% |
| Male | 2.33% | 2.55% | 1.81% |
Age-specific disability prevalence (%)
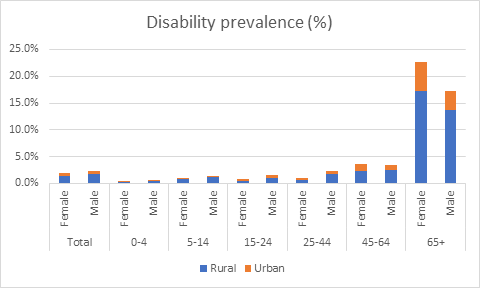
| Rural | Urban | Total | ||
|---|---|---|---|---|
| Total | Female | 1.4% | 0.6% | 2.0% |
| Male | 1.8% | 0.5% | 2.3% | |
| 0-4 | Female | 0.3% | 0.1% | 0.4% |
| Male | 0.4% | 0.1% | 0.5% | |
| 5-14 | Female | 0.7% | 0.2% | 0.9% |
| Male | 1.1% | 0.3% | 1.4% | |
| 15-24 | Female | 0.5% | 0.4% | 0.9% |
| Male | 1.1% | 0.5% | 1.6% | |
| 25-44 | Female | 0.6% | 0.4% | 0.9% |
| Male | 1.7% | 0.6% | 2.2% | |
| 45-64 | Female | 2.2% | 1.3% | 3.6% |
| Male | 2.6% | 0.8% | 3.4% | |
| 65+ | Female | 17.2% | 5.4% | 22.6% |
| Male | 13.7% | 3.6% | 17.3% | |
Age distribution (%)
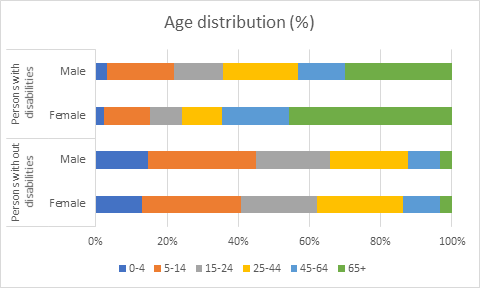
| 0-4 | 5-14 | 15-24 | 25-44 | 45-64 | 65+ | ||
|---|---|---|---|---|---|---|---|
| Persons without disabilities | Female | 12.9% | 27.9% | 21.2% | 24.1% | 10.5% | 3.2% |
| Male | 14.6% | 30.5% | 20.7% | 22.0% | 8.9% | 3.4% | |
| Persons with disabilities | Female | 2.3% | 12.9% | 9.2% | 11.2% | 18.9% | 45.6% |
| Male | 3.2% | 18.8% | 13.8% | 21.0% | 13.2% | 30.0% | |
Type of disability/difficulty (%)
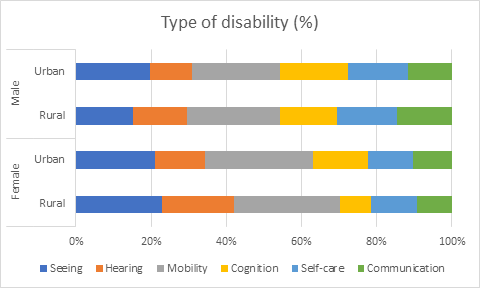
| Seeing | Hearing | Mobility | Cognition | Self-care | Communication | ||
|---|---|---|---|---|---|---|---|
| Female | Rural | 22.8% | 19.3% | 28.0% | 8.3% | 12.1% | 9.4% |
| Urban | 20.9% | 13.5% | 28.6% | 14.7% | 12.0% | 10.2% | |
| Male | Rural | 15.2% | 14.4% | 24.7% | 15.1% | 15.8% | 14.7% |
| Urban | 19.7% | 11.3% | 23.4% | 17.9% | 16.0% | 11.6% | |
Note: Persons may report more than one type of disability.
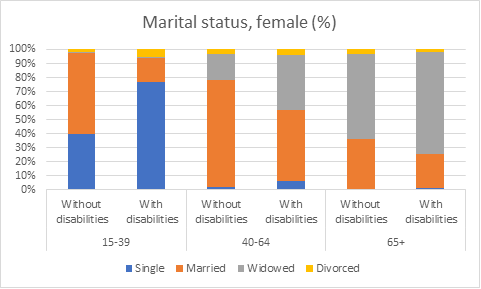
By marital status by age group
| Single | Married | Widowed | Divorced | ||
|---|---|---|---|---|---|
| 15-39 | Without disabilities | 39.9% | 57.4% | 1.0% | 1.7% |
| With disabilities | 76.8% | 17.3% | 0.3% | 5.6% | |
| 40-64 | Without disabilities | 2.0% | 76.3% | 18.4% | 3.3% |
| With disabilities | 5.8% | 50.7% | 39.5% | 3.9% | |
| 65+ | Without disabilities | 0.7% | 35.3% | 60.5% | 3.5% |
| With disabilities | 1.2% | 24.4% | 72.5% | 1.9% | |
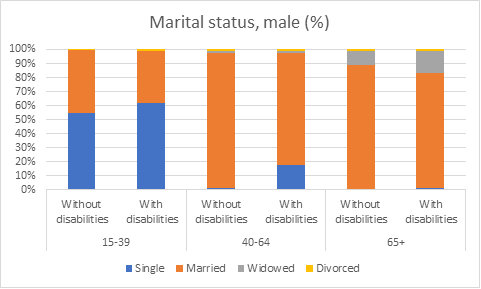
| Single | Married | Widowed | Divorced | ||
|---|---|---|---|---|---|
| 15-39 | Without disabilities | 55.0% | 44.7% | 0.1% | 0.3% |
| With disabilities | 61.8% | 37.1% | 0.0% | 1.1% | |
| 40-64 | Without disabilities | 1.1% | 96.5% | 1.2% | 1.2% |
| With disabilities | 17.5% | 79.9% | 1.3% | 1.3% | |
| 65+ | Without disabilities | 0.3% | 88.6% | 9.9% | 1.1% |
| With disabilities | 1.1% | 81.9% | 16.1% | 1.0% | |
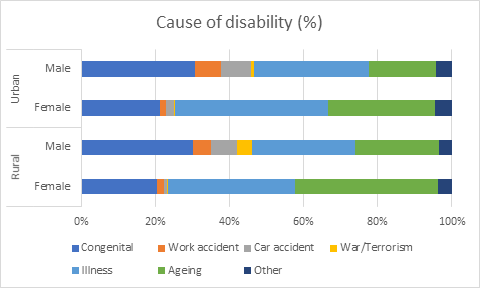
Cause of disability (%)
| Congenital | Work accident | Car accident | War/Terrorism | Illness | Ageing | Other | ||
|---|---|---|---|---|---|---|---|---|
| Rural | Female | 20.5% | 1.9% | 0.9% | 0.2% | 34.2% | 38.6% | 3.7% |
| Male | 30.1% | 5.1% | 6.8% | 4.1% | 27.7% | 22.6% | 3.6% | |
| Urban | Female | 21.4% | 1.6% | 2.1% | 0.1% | 41.3% | 28.9% | 4.6% |
| Male | 30.7% | 7.2% | 7.9% | 0.9% | 31.0% | 17.9% | 4.4% | |
Note: Data source includes a more detailed breakdown for work accident (by accident and disease), war/terrorism (by land mine and shooting) and illness (by disease and multiple diseases).
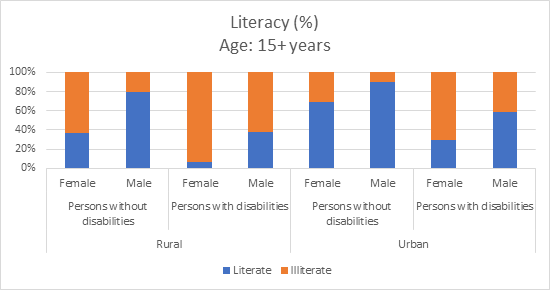
By literacy status age: 15+ years
| Literate | Illiterate | |||
|---|---|---|---|---|
| Rural | Persons without disabilities | Female | 36.5% | 63.5% |
| Male | 79.5% | 20.5% | ||
| Persons with disabilities | Female | 6.7% | 93.3% | |
| Male | 37.7% | 62.3% | ||
| Urban | Persons without disabilities | Female | 69.3% | 30.7% |
| Male | 90.0% | 10.0% | ||
| Persons with disabilities | Female | 29.3% | 70.7% | |
| Male | 58.4% | 41.6% | ||
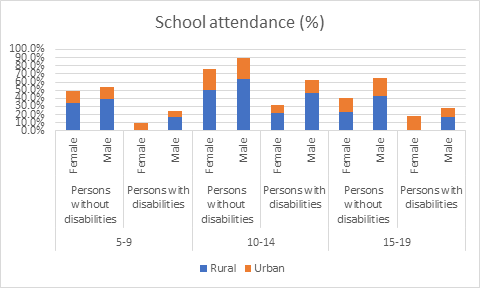
By school attendance
| Rural | Urban | Total | |||
|---|---|---|---|---|---|
| 5-9 | Persons without disabilities | Female | 34.3% | 14.7% | 49.0% |
| Male | 39.0% | 15.3% | 54.3% | ||
| Persons with disabilities | Female | 1.6% | 7.4% | 9.0% | |
| Male | 16.8% | 7.1% | 23.9% | ||
| 10-14 | Persons without disabilities | Female | 50.2% | 25.8% | 76.0% |
| Male | 63.2% | 26.4% | 89.6% | ||
| Persons with disabilities | Female | 21.4% | 10.5% | 31.9% | |
| Male | 46.6% | 16.0% | 62.6% | ||
| 15-19 | Persons without disabilities | Female | 22.6% | 18.4% | 40.9% |
| Male | 43.1% | 21.2% | 64.4% | ||
| Persons with disabilities | Female | 1.5% | 16.9% | 18.3% | |
| Male | 16.7% | 10.9% | 27.5% | ||
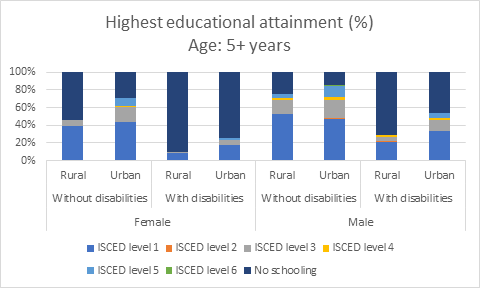
By educational attainment age: 5+ years
| ISCED level 1 | ISCED level 2 | ISCED level 3 | ISCED level 4 | ISCED level 5 | ISCED level 6 | No schooling | |||
|---|---|---|---|---|---|---|---|---|---|
| Female | Without disabilities | Rural | 39.4% | 0.1% | 6.0% | 0.4% | 0.4% | 0.0% | 53.7% |
| Urban | 43.3% | 0.2% | 17.0% | 1.8% | 8.3% | 0.2% | 29.2% | ||
| With disabilities | Rural | 8.5% | 0.0% | 1.5% | 0.1% | 0.0% | 0.0% | 89.9% | |
| Urban | 17.1% | 0.4% | 5.4% | 0.5% | 1.9% | 0.0% | 74.7% | ||
| Male | Without disabilities | Rural | 52.6% | 0.5% | 15.7% | 2.1% | 4.1% | 0.1% | 24.9% |
| Urban | 47.4% | 0.9% | 20.7% | 3.3% | 12.1% | 1.0% | 14.8% | ||
| With disabilities | Rural | 20.9% | 0.7% | 5.1% | 1.9% | 0.6% | 0.0% | 70.9% | |
| Urban | 33.8% | 0.2% | 12.1% | 1.7% | 6.1% | 0.5% | 45.7% | ||
Note: Data source includes a more detailed breakdown for ISCED levels 2 (by pre-high school vocational and non-vocational diploma), 3 (by high school vocational and non-vocational) and 6 (by post university diploma, master’s degree and PhD).
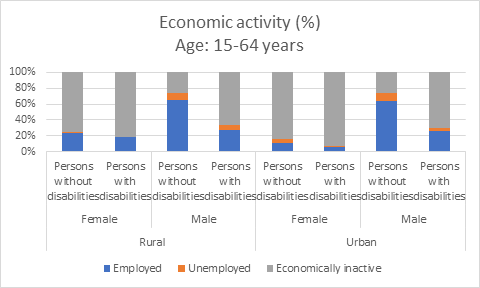
By economic activity age: 15–64 years
| Employed | Unemployed | Economically inactive | |||
|---|---|---|---|---|---|
| Rural | Female | Persons without disabilities | 23.1% | 1.9% | 75.0% |
| Persons with disabilities | 18.0% | 1.1% | 80.9% | ||
| Male | Persons without disabilities | 64.5% | 9.4% | 26.1% | |
| Persons with disabilities | 27.8% | 5.4% | 66.9% | ||
| Urban | Female | Persons without disabilities | 11.4% | 4.8% | 83.7% |
| Persons with disabilities | 6.2% | 1.1% | 92.7% | ||
| Male | Persons without disabilities | 64.0% | 10.4% | 25.6% | |
| Persons with disabilities | 26.3% | 3.0% | 70.7% | ||
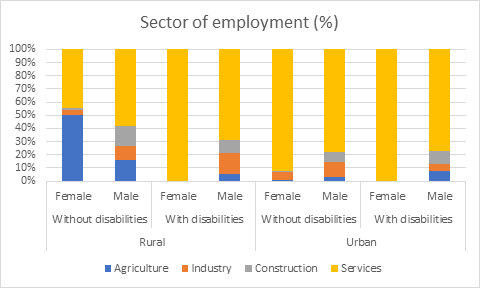
By sector of employment
| Agriculture | Industry | Construction | Services | |||
|---|---|---|---|---|---|---|
| Rural | Without disabilities | Female | 50.4% | 3.8% | 1.5% | 44.3% |
| Male | 15.8% | 10.5% | 15.9% | 57.8% | ||
| With disabilities | Female | 0.0% | 0.0% | 0.0% | 100.0% | |
| Male | 5.1% | 16.3% | 9.8% | 68.7% | ||
| Urban | Without disabilities | Female | 0.8% | 5.9% | 0.9% | 92.4% |
| Male | 2.7% | 11.7% | 7.8% | 77.9% | ||
| With disabilities | Female | 0.0% | 0.0% | 0.0% | 100.0% | |
| Male | 8.0% | 4.8% | 9.7% | 77.5% | ||