Egypt 2006
Socio-economic indicators
| HDI: |
0.633 |
| Life expectancy at birth: |
71.9 |
| GNI: |
4,737 |
Source: UNDP.
Figure 1: Persons with disabilities
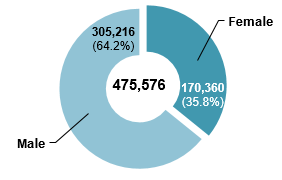
| Female |
Male |
Total |
| 35.8% |
64.2% |
100% |
| 170,360 |
305,216 |
475,576 |
Figure 2: Total population
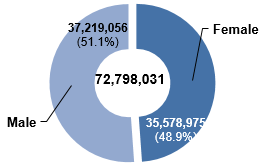
| Female |
Male |
Total |
| 48.9% |
51.1% |
100.0% |
| 35,578,975 |
37,219,056 |
72,798,031 |
Figure 3: Age-specific prevalence of disability (in percentage)

| Female |
Male |
Total |
| 0.5 |
0.8 |
0.7 |
Figure 4: Age distribution of persons with disabilities (in percentage)1

| |
Female |
Male |
Total |
|
| 0-14 |
17.2 |
14.0 |
15.1 |
0-14 |
| 15-24 |
22.3 |
21.6 |
21.9 |
15-24 |
| 25-44 |
26.3 |
31.6 |
29.7 |
25-44 |
| 45-64 |
17.7 |
22.0 |
20.5 |
45-64 |
| 65+ |
16.5 |
10.8 |
12.8 |
65+ |
Type of disability / difficulty (in percentage)
| |
Female |
Male |
Total |
| Blind |
10 |
8.9 |
9.3 |
| One-eyed |
4 |
4 |
4 |
| Deaf |
4.3 |
3 |
3.5 |
| Mute |
2.9 |
2.4 |
2.6 |
| Deaf and mute |
8 |
5.8 |
6.6 |
| Mentally retarded |
23.2 |
21.9 |
22.4 |
| Loss of one / both hands |
1.1 |
3 |
2.3 |
| Loss of one / both legs |
2.1 |
4.6 |
3.7 |
| Infantile paralysis |
13.1 |
13.2 |
13.1 |
| Total / partial paralysis |
14.6 |
14.9 |
14.8 |
| Other disability |
16.7 |
18.3 |
17.7 |
Cause of disability / difficulty (in percentage)
| |
Female |
Male |
Total |
| Congenital |
54.6 |
50.4 |
51.9 |
| Birth-related conditions |
5.8 |
5.2 |
5.4 |
| Epidemic disease |
6.6 |
6.8 |
6.8 |
| Other diseases |
6.8 |
7 |
6.9 |
| Physical / psychological abuse |
1.6 |
2 |
1.8 |
| Injury / accident |
7.2 |
17.6 |
13.9 |
| Old age |
13.6 |
7.1 |
9.4 |
| Other |
3.7 |
4.1 |
3.9 |
Figure 5: Persons with disabilities by geographical location (in percentage)1
| |
Female |
Male |
Total |
| Urban |
41.7 |
41.2 |
41.4 |
| Rural |
58.3 |
58.8 |
58.6 |
Figure 6: Total population by geographical location (in percentage)
| |
Female |
Male |
Total |
| Urban |
43.2 |
43.0 |
43.1 |
| Rural |
56.8 |
57.0 |
56.9 |
Figure 7: Persons with disabilities (female: 16 years and above; male: 18 years and above) by marital status (in percentage)
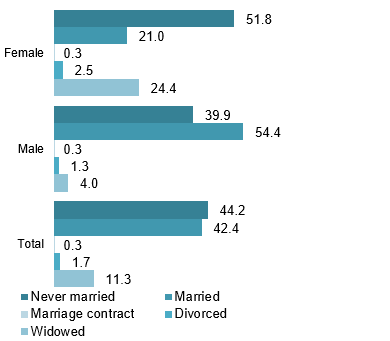
| |
Female |
Male |
Total |
| Never married |
51.8 |
39.9 |
44.2 |
| Married |
21.0 |
54.4 |
42.4 |
| Divorced |
2.5 |
1.3 |
1.7 |
| Widowed |
24.4 |
4.0 |
11.3 |
| Marriage contract |
0.3 |
0.3 |
0.3 |
Figure 8: Total population (female: 16 years and above; male: 18 years and above) by marital status (in percentage)
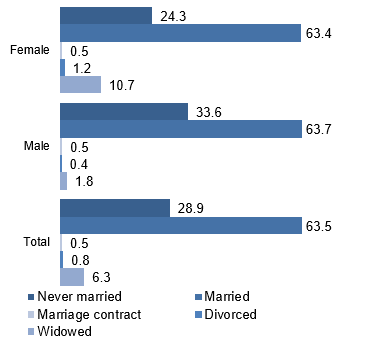
| |
Female |
Male |
Total |
| Married |
63.4 |
63.7 |
63.5 |
| Never married |
24.3 |
33.6 |
28.9 |
| Widowed |
10.7 |
1.8 |
6.3 |
| Divorced |
1.2 |
0.4 |
0.8 |
| Marriage contract |
0.5 |
0.5 |
0.5 |
Persons with disabilities (10 years and above) by educational attainment (in percentage)
| |
Female |
Male |
Total |
| Illiterate |
72 |
55.4 |
61.3 |
| Basic knowledge / read and write |
7.5 |
12 |
10.4 |
| Below intermediate |
8.7 |
12.3 |
11 |
| Intermediate |
8.6 |
14.3 |
12.3 |
| Above intermediate |
0.8 |
1.4 |
1.2 |
| University |
2.3 |
4.4 |
3.6 |
| University and above |
0.1 |
0.2 |
0.1 |
Total population (10 years and above) by educational attainment (in percentage)
| |
Female |
Male |
Total |
| Illiterate |
37.3 |
22.3 |
29.6 |
| Basic knowledge / read and write |
11.2 |
14.6 |
12.9 |
| Under intermediate |
17.9 |
20.8 |
19.4 |
| Intermediate |
23.3 |
28.2 |
25.8 |
| Above intermediate |
2.2 |
2.8 |
2.5 |
| University |
7.8 |
10.8 |
9.4 |
| University and above |
0.2 |
0.3 |
0.2 |
| Not specified |
0.1 |
0.1 |
0.1 |
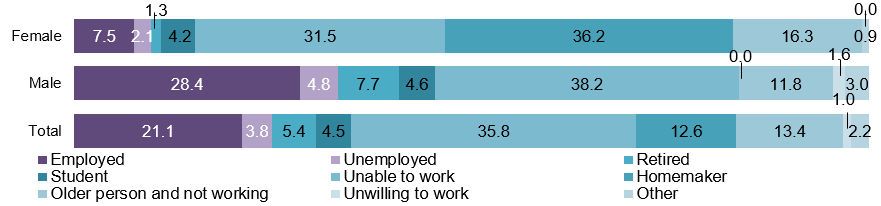
Figure 9: Persons with disabilities (15 years and above) by economic activity (in percentage)
| |
Female |
Male |
Total |
| Employed |
7.5 |
28.4 |
21.1 |
| Unemployed |
2.1 |
4.8 |
3.8 |
| Student |
4.2 |
4.6 |
4.5 |
| Homemaker |
36.2 |
0 |
12.6 |
| Retired |
1.3 |
7.7 |
5.4 |
| Unable to work |
31.5 |
38.2 |
35.8 |
| Older person and not working |
16.3 |
11.8 |
13.4 |
| Unwilling to work |
0 |
1.6 |
1 |
| Other |
0.9 |
3 |
2.2 |
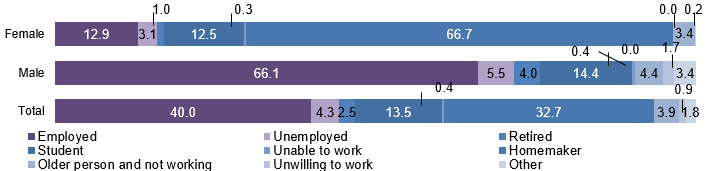
Figure 10: Total population (15 years and above) by economic activity (in percentage)
| |
Female |
Male |
Total |
| Employed |
12.9 |
66.1 |
40 |
| Unemployed |
3.1 |
5.5 |
4.3 |
| Student |
12.5 |
14.4 |
13.5 |
| Homemaker |
66.7 |
0 |
32.7 |
| Retired |
1 |
4 |
2.5 |
| Unable to work |
0.3 |
0.4 |
0.4 |
| Older person and not working |
3.4 |
4.4 |
3.9 |
| Unwilling to work |
0 |
1.7 |
0.9 |
| Other |
0.2 |
3.4 |
1.8 |
Source: Central Agency for Public Mobilization and Statistics (2006).
SIGNATURE / RATIFICATION OF THE CONVENTION ON THE RIGHTS OF PERSONS WITH DISABILITIES & ITS OPTIONAL PROTOCOL
| Convention |
Signed |
4.4.2007 |
| Ratified / Acceded |
14.4.2008 |
| Optional Protocol |
Signed |
No |
| Ratified / Acceded |
No |
Source: UN (2014).
NATIONAL INSTITUTIONAL FRAMEWORK FOR DISABILITY / PERSONS WITH DISABILITIES
| National coordination mechanism: |
Name: |
National Council on Disability Affairs |
| Year established: |
2012 |
| Chair: |
Prime Minister |
| Persons with Disabilities represented? |
Yes |
| Additional mechanisms: |
System of focal points for disability related matters in ministries or other governmental institutions |
NATIONAL DEFINITION OF DISABILITY / PERSONS WITH DISABILITIES
Every person who has a decreased capability or who is unable to rely on themselves to work, or to assume or maintain a job, or to perform other tasks due to bodily, mental, or sensory deficiencies, or due to congenital disabilities (Law No. 39 on Rehabilitation of the Disabled amended by Law No. 49, 1982).
NATIONAL LEGISLATIVE FRAMEWORK FOR DISABILITY / PERSONS WITH DISABILTIES (YEAR OF ADOPTION)
| Articles on disability included in the constitution? |
Yes |
| General / overarching national disability law |
Law No. 39 on Rehabilitation of the Disabled (1975) amended by Law No. 49 (1982) |
| National disability strategy / plan |
No |
Source: ESCWA, based on data collected from government focal points through the ESCWA Questionnaire on the Implementation of the Convention on the Rights of Persons with Disabilities and the Arab Decade for Persons with Disabilities (2013).
Footnotes:
1 Data pertains to nationals only.