Table of contents:
Syrian Arab Republic 2007
| HDI: | 0.623 | |||
|---|---|---|---|---|
| Life expectancy at birth: | 75.3 | |||
| GNI: | 4,331 | |||
Source: UNDP.
Figure 1: Persons with disabilities
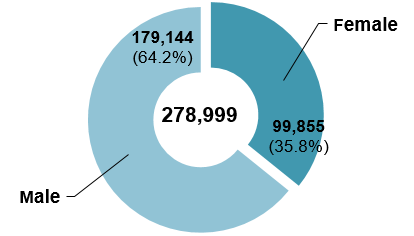
| Female | Male | Total |
|---|---|---|
| 35.8% | 64.2% | 100.0% |
| 99,855 | 179,144 | 278,999 |
Figure 2: Total population1
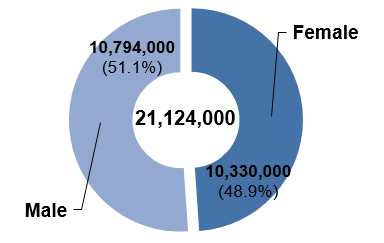
| Female | Male | Total |
|---|---|---|
| 48.9% | 51.1% | 100.0% |
| 10,330,000 | 10,794,000 | 21,124,000 |
Figure 3: Age distribution of persons with disabilities (in percentage)
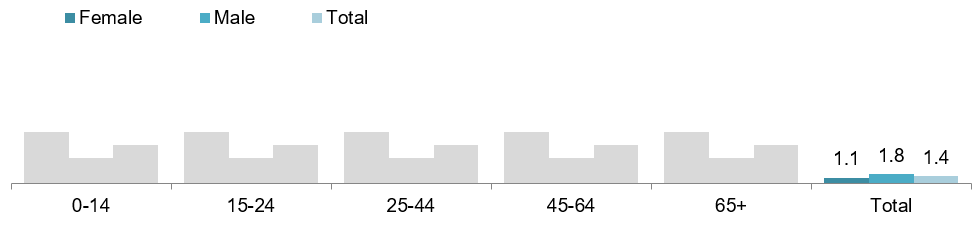
| Female | Male | Total | |
|---|---|---|---|
| Total | 1.1 | 1.8 | 1.4 |
Figure 4: Persons with disabilities by age group (in percentage)
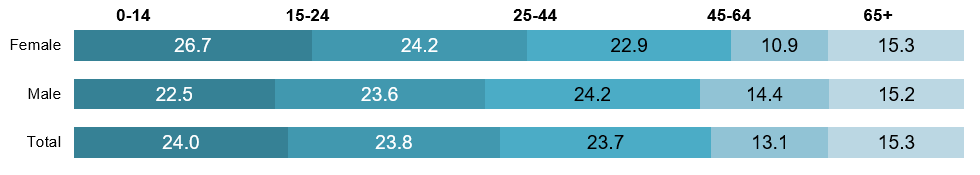
| Female | Male | Total | |
|---|---|---|---|
| 0-14 | 26.7 | 22.5 | 24.0 |
| 15-24 | 24.2 | 23.6 | 23.8 |
| 25-44 | 22.9 | 24.2 | 23.7 |
| 45-64 | 10.9 | 14.4 | 13.1 |
| 65+ | 15.3 | 15.2 | 15.3 |
Type of disability / difficulty (in percentage)
| Female | Male | Total | |||||||
|---|---|---|---|---|---|---|---|---|---|
| Physical disability | 39.0 | 46.2 | 43.6 | ||||||
| Hearing disability | 5.4 | 4.7 | 4.9 | ||||||
| Speech disability | 6.9 | 5.9 | 6.2 | ||||||
| Mental disability | 23.7 | 19.4 | 20.9 | ||||||
| Psychological disability | 2.3 | 2.8 | 2.6 | ||||||
| Multiple disabilities | 12.6 | 9.7 | 10.7 | ||||||
| Not specified | 0.3 | 0.0 | 0.1 | ||||||
| Visual disability | 10.0 | 11.3 | 10.8 | ||||||
Cause of disability / difficulty (in percentage)
| Female | Male | Total | |||||||
|---|---|---|---|---|---|---|---|---|---|
| Congenital | 54.1 | 46.4 | 49.1 | ||||||
| Disease | 26.1 | 27.6 | 27.0 | ||||||
| Accident | 6.6 | 14.4 | 11.6 | ||||||
| Old age | 10.2 | 9.3 | 9.7 | ||||||
| Other causes | 3.0 | 2.3 | 2.6 | ||||||
Figure 5: Persons with disabilities by geographical location (in percentage)
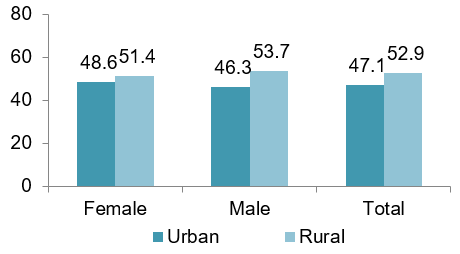
| Female | Male | Total | |
|---|---|---|---|
| Urban | 48.6 | 46.3 | 47.1 |
| Rural | 51.4 | 53.7 | 52.9 |
Figure 6: Total population by geographical location (in percentage)1

| Female | Male | Total | |
|---|---|---|---|
| Urban | 53.3 | 53.7 | 53.5 |
| Rural | 46.7 | 46.3 | 46.5 |
Figure 7: Persons with disabilities (15 years and above) by marital status (in percentage)
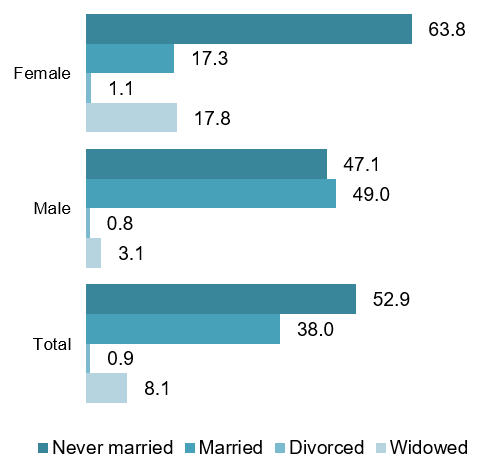
| Female | Male | Total | |
|---|---|---|---|
| Never married | 63.8 | 47.1 | 52.9 |
| Married | 17.3 | 49.0 | 38.0 |
| Divorced | 1.1 | 0.8 | 0.9 |
| Widowed | 17.8 | 3.1 | 8.1 |
Figure 8: Total population (15 years and above) by marital status (in percentage)1
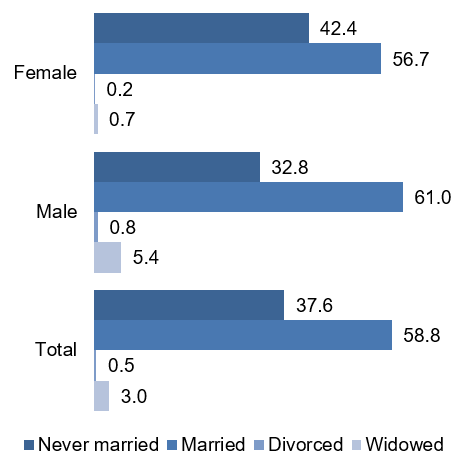
| Female | Male | Total | |
|---|---|---|---|
| Married | 56.7 | 61.0 | 58.8 |
| Never married | 42.4 | 32.8 | 37.6 |
| Widowed | 0.7 | 5.4 | 3.0 |
| Divorced | 0.2 | 0.8 | 0.5 |
Persons with disabilities (10 years and above) by educational attainment (in percentage)
| Female | Male | Total | |||||||
|---|---|---|---|---|---|---|---|---|---|
| Illiterate | 60.1 | 41.2 | 47.8 | ||||||
| Read and write | 14.9 | 18.7 | 17.4 | ||||||
| Primary | 15.1 | 25.9 | 22.1 | ||||||
| Preparatory | 5.9 | 9.4 | 8.2 | ||||||
| Secondary | 1.9 | 3.4 | 2.9 | ||||||
| Intermediate institute | 1.3 | 0.8 | 1.0 | ||||||
| University degree | 0.8 | 0.4 | 0.5 | ||||||
| Not specified | 0.0 | 0.1 | 0.1 | ||||||
Total population (15 years and above) by educational attainment (in percentage)1
| Female | Male | Total | |||||||
|---|---|---|---|---|---|---|---|---|---|
| Illiterate | 6.1 | 18.1 | 12.0 | ||||||
| Read and write | 18.0 | 17.5 | 17.8 | ||||||
| Primary | 26.7 | 22.6 | 24.7 | ||||||
| Preparatory | 21.0 | 18.6 | 19.8 | ||||||
| Secondary | 15.1 | 13.2 | 14.2 | ||||||
| Intermediate institute | 6.1 | 5.9 | 6.0 | ||||||
| University degree and above | 7.0 | 4.1 | 5.6 | ||||||
| Not specified | 0.0 | 0.0 | 0.0 | ||||||
Figure 9: Persons with disabilities (15 years and above) by economic activity (in percentage)
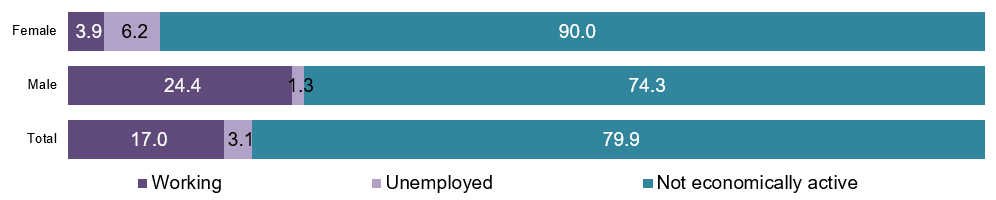
| Female | Male | Total | |
|---|---|---|---|
| Working | 3.9 | 24.4 | 17.0 |
| Unemployed | 6.2 | 1.3 | 3.1 |
| Not economically active | 90.0 | 74.3 | 79.9 |
Figure 10: Total population (15 years and above) by economic activity (in percentage)1
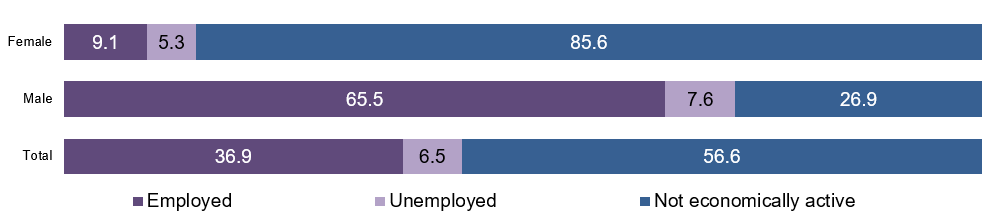
| Female | Male | Total | |
|---|---|---|---|
| Employed | 9.1 | 65.5 | 36.9 |
| Unemployed | 5.3 | 7.6 | 6.5 |
| Not economically active | 85.6 | 26.9 | 56.6 |
Sources: Data on persons with disabilities is from Central Bureau of Statistics (2007); data on the total population is from Central Bureau of Statistics (2011a) and Central Bureau of Statistics (2011b).
| Convention | Signed | 30.3.2007 |
|---|---|---|
| Ratified / Acceded | 10.7.2009 | |
| Optional Protocol | Signed | No |
| Ratified / Acceded | 10.7.2009 |
Source: UN (2014).
Footnotes:
1 Data on the total population is from different sources than the data on persons with disabilities, which limits comparability between the two. Data for the indicators 'total population by sex' and 'total population by geographical location' is from the Statistical Yearbook (Central Bureau of Statistics (2011a)); data for the indicators 'total population by marital status', 'total population by educational attainment' and 'total population by economic activity' is from the Labour Force Survey (Central Bureau of Statistics (2011b)).