Table of contents:
Saudi Arabia 2004(1)
| HDI: | 0.748 | |||
|---|---|---|---|---|
| Life expectancy at birth: | 72.5 | |||
| GNI: | 20,780 | |||
Source: UNDP.
Figure 1: Persons with disabilities
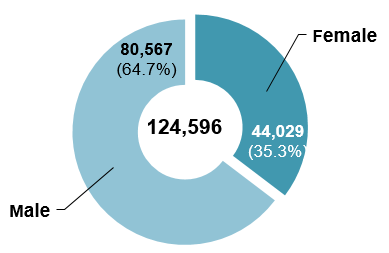
| Female | Male | Total |
|---|---|---|
| 35.3% | 64.7% | 100.0% |
| 44,029 | 80,567 | 124,596 |
Figure 2: Total population
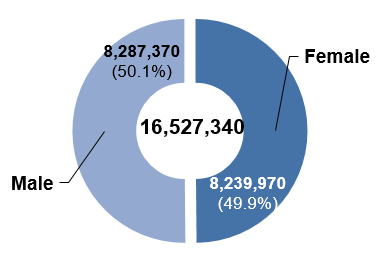
| Female | Male | Total |
|---|---|---|
| 49.9% | 50.1% | 100.0% |
| 8,239,970 | 8,287,370 | 16,527,340 |
Figure 3: Age-specific prevalence of disability (in percentage)
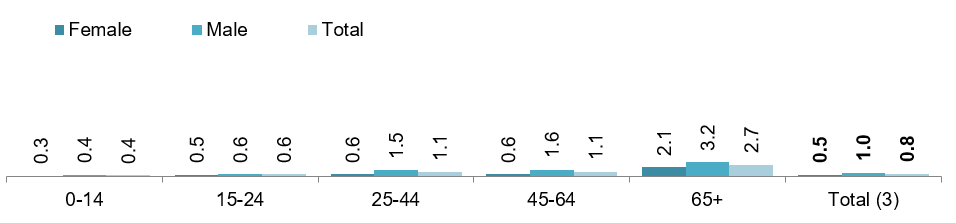
| Female | Male | Total | |
|---|---|---|---|
| 0-14 | 0.3 | 0.4 | 0.4 |
| 15-24 | 0.5 | 0.6 | 0.6 |
| 25-44 | 0.6 | 1.5 | 1.1 |
| 45-64 | 0.6 | 1.6 | 1.1 |
| 65+ | 2.1 | 3.2 | 2.7 |
| Total(3) | 0.5 | 1.0 | 0.8 |
Figure 4: Age distribution of persons with disabilities (in percentage)
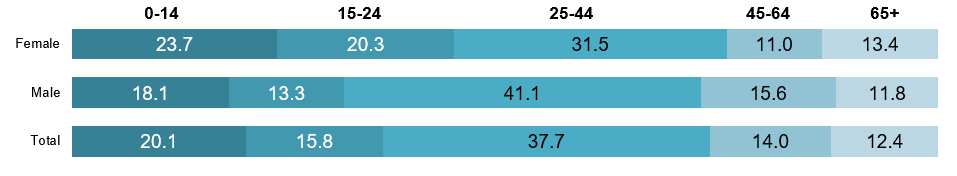
| Female | Male | Total | |
|---|---|---|---|
| 0-14 | 23.7 | 18.1 | 20.1 |
| 15-24 | 20.3 | 13.3 | 15.8 |
| 25-44 | 31.5 | 41.1 | 37.7 |
| 45-64 | 11.0 | 15.6 | 14.0 |
| 65+ | 13.4 | 11.8 | 12.4 |
Type of disability / difficulty (in percentage)
| Female | Male | Total | |
|---|---|---|---|
| Blind | 12.1 | 14.5 | 13.6 |
| Deaf | 2.5 | 2 | 2.2 |
| Deaf and mute | 13.7 | 14.3 | 14.1 |
| Loss of organ | 1.8 | 2.6 | 2.3 |
| Mental retardation | 22.1 | 18.5 | 19.8 |
| Paralysis | 23.9 | 23.8 | 23.8 |
| Other | 23.9 | 24.3 | 24.2 |
Figure 5: Persons with disabilities (15 years and above)
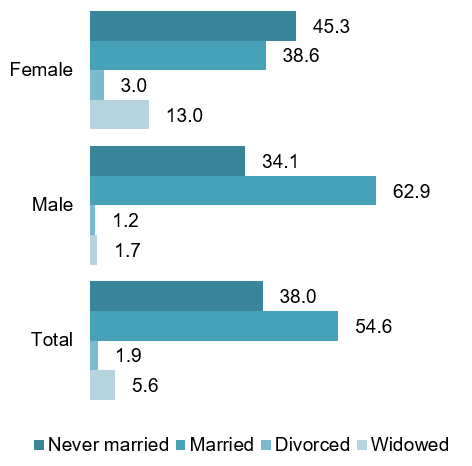
| Female | Male | Total | |
|---|---|---|---|
| Never married | 45.3 | 34.1 | 38.0 |
| Married | 38.6 | 62.9 | 54.6 |
| Divorced | 3.0 | 1.2 | 1.9 |
| Widowed | 13.0 | 1.7 | 5.6 |
Figure 6: Total population (15 years and above)
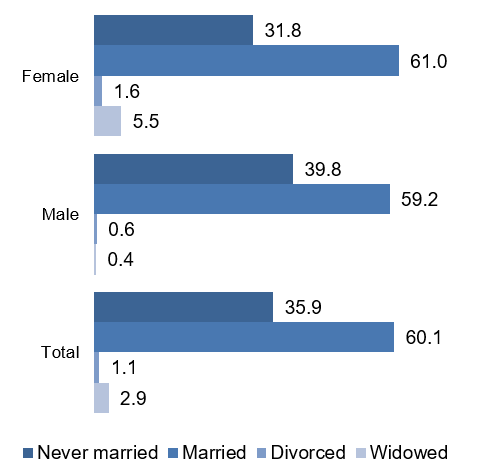
| Female | Male | Total | |
|---|---|---|---|
| Never married | 31.8 | 39.8 | 35.9 |
| Married | 61.0 | 59.2 | 60.1 |
| Divorced | 1.6 | 0.6 | 1.1 |
| Widowed | 5.5 | 0.4 | 2.9 |
Total population (10 years and above) by educational attainment (in percentage)
| Female | Male | Total | |
|---|---|---|---|
| Illiterate | 21.2 | 8.2 | 14.7 |
| Read and write | 15.4 | 13.9 | 14.7 |
| Primary | 19.8 | 23 | 21.4 |
| Intermediate | 16.4 | 22.4 | 19.4 |
| Secondary or equivalent | 15.4 | 18.6 | 17 |
| Pre-university diploma | 2.7 | 3.5 | 3.1 |
| University | 8.8 | 9.5 | 9.1 |
| Master / higher diploma | 0.1 | 0.7 | 0.4 |
| Doctorate | 0.1 | 0.3 | 0.2 |
Figure 7: Total population (15 years and above) by economic activity (in percentage)
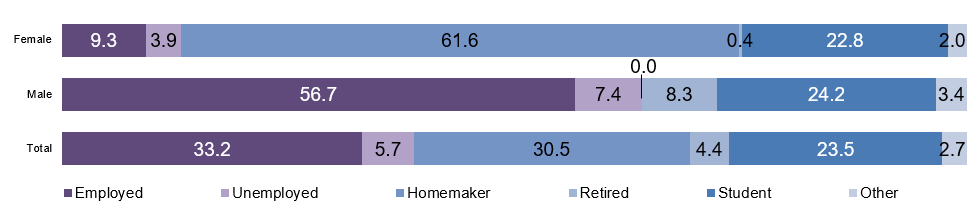
| Female | Male | Total | |
|---|---|---|---|
| Employed | 9.3 | 56.7 | 33.2 |
| Unemployed | 3.9 | 7.4 | 5.7 |
| Homemaker | 61.6 | 0.0 | 30.5 |
| Retired | 0.4 | 8.3 | 4.4 |
| Student | 22.8 | 24.2 | 23.5 |
| Other | 2.0 | 3.4 | 2.7 |
Sources: Central Department of Statistics and Information (2004); Central Department of Statistics and Information (2007).
| Convention | Signed | No |
|---|---|---|
| Ratified / Acceded | 24.6.2008 | |
| Optional Protocol | Signed | No |
| Ratified / Acceded | 24.6.2008 |
Source: UN (2014).
| National coordination mechanism: | Name: | Committee for the Coordination of Services for Persons with Disabilities |
|---|---|---|
| Year established: | 1979 | |
| Chair: | Assistant Deputy Minister for Social Welfare | |
| Persons with disabilities represented? | Yes | |
| Additional mechanisms: | System of focal points for disability related matters in line ministries or other governmental institutions | |
| Committee for the implementation of the Convention of the Rights of Persons with Disabilities | ||
| Committee for the implementation of the Arab Decade | ||
| Higher Council for the Affairs of the Disabled | ||
| Unit for Persons with Disabilities, Human Rights Commission | ||
NATIONAL DEFINITION OF DISABILITY / PERSONS WITH DISABILITIES
Every person with a constant total or partial disability in their physical or sensory or mental or communicative or learning or psychological capabilities, to the extent that it reduces the possibility of them meeting their normal needs under conditions similar to those of non-disabled persons (Code for the Welfare of the Disabled, 2000).
| Articles on disability included in the constitution? | Yes |
|---|---|
| General / overarching national disability law | The Basic List of Rehabilitation Programs for the Disabled (1979); Code for the Welfare of the Disabled (2000) |
| National disability strategy / plan | Sectoral strategies4 |
Source: ESCWA, based on data collected from government focal points through the ESCWA Questionnaire on the Implementation of the Convention on the Rights of Persons with Disabilities and the Arab Decade for Persons with Disabilities (2013).
Footnotes:
1 All data pertains to nationals only.
2 Data for these three indicators is from 2005.
3 The prevalence rate of persons with disabilities is 0.8 per cent according to the Demographic Survey (Central Department of Statistics and Information (2007)).
4 National Youth Strategy (2010) and National Strategy for the Employment of Persons with Disabilities (2011).