Table of contents:
Sudan 2008(1)
| HDI: | 0.405 | |||
|---|---|---|---|---|
| Life expectancy at birth: | 60.5 | |||
| GNI: | 1,796 | |||
Source: UNDP.
Figure 1: Persons with disabilities
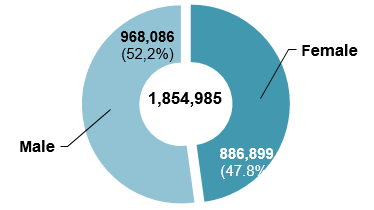
| Female | Male | |
|---|---|---|
| 47.8% | 52.2% | 100.0% |
| 886,899 | 968,086 | 1,854,985 |
Figure 2: Total population
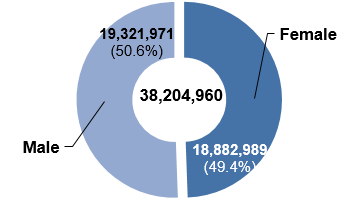
| Female | Male | Total |
|---|---|---|
| 49.4% | 50.6% | 100.0% |
| 18,882,989 | 19,321,971 | 38,204,960 |
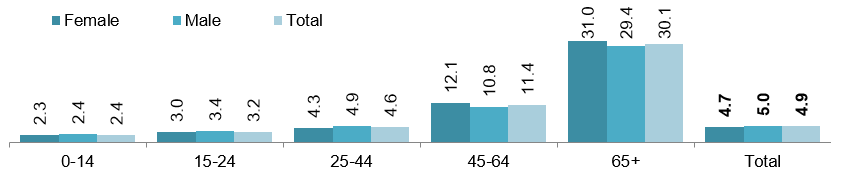
Figure 3: Age-specific prevalence of disability (in percentage)
| Female | Male | Total | |
|---|---|---|---|
| 0-14 | 2.3 | 2.4 | 2.4 |
| 15-24 | 3.0 | 3.4 | 3.2 |
| 25-44 | 4.3 | 4.9 | 4.6 |
| 45-64 | 12.1 | 10.8 | 11.4 |
| 65+ | 31.0 | 29.4 | 30.1 |
| Total | 4.7 | 5.0 | 4.9 |
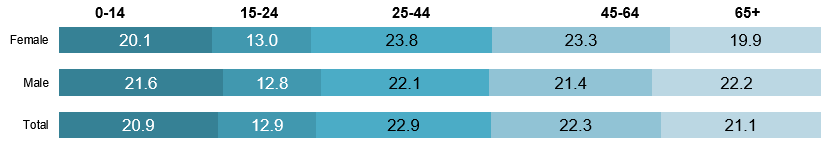
Figure 4: Age distribution of persons with disabilities (in percentage)
| Female | Male | Total | |
|---|---|---|---|
| 0-14 | 20.1 | 21.6 | 20.9 |
| 15-24 | 13.0 | 12.8 | 12.9 |
| 25-44 | 23.8 | 22.1 | 22.9 |
| 45-64 | 23.3 | 21.4 | 22.3 |
| 65+ | 19.9 | 22.2 | 21.1 |
Type of disability / difficulty (in percentage)2
| Female | Male | Total | |||||||
|---|---|---|---|---|---|---|---|---|---|
| Limited use of leg | 17.7 | 18.6 | 18.1 | ||||||
| Loss of leg | 2.9 | 3.7 | 3.3 | ||||||
| Limited use of hand | 5.4 | 6.0 | 5.7 | ||||||
| Loss of hand | 1.2 | 1.5 | 1.4 | ||||||
| Hearing difficulty | 13.8 | 12.6 | 13.2 | ||||||
| Deaf | 3.4 | 3.4 | 3.4 | ||||||
| Visual difficulty | 32.6 | 30.5 | 31.5 | ||||||
| Blind | 5.3 | 4.7 | 5.0 | ||||||
| Speech difficulty | 3.7 | 4.2 | 4.0 | ||||||
| Mute | 2.2 | 2.5 | 2.4 | ||||||
| Mental difficulty | 24.3 | 24.0 | 24.2 | ||||||
Figure 5: Persons with disabilities by geographical location (in percentage)
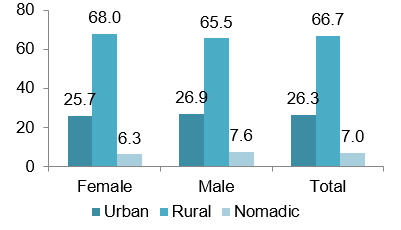
| Female | Male | Total | |
|---|---|---|---|
| Urban | 25.7 | 26.9 | 26.3 |
| Rural | 68.0 | 65.5 | 66.7 |
| Nomadic | 6.3 | 7.6 | 7.0 |
Figure 6: Total population by geographical location (in percentage)
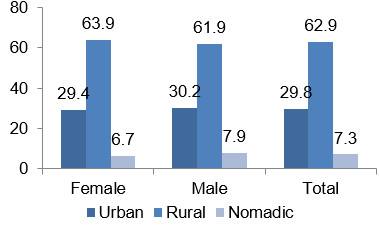
| Female | Male | Total | |
|---|---|---|---|
| Urban | 29.4 | 30.2 | 29.8 |
| Rural | 63.9 | 61.9 | 62.9 |
| Nomadic | 6.7 | 7.9 | 7.3 |
Figure 7: Persons with disabilities (12 years and above) by marital status (in percentage)
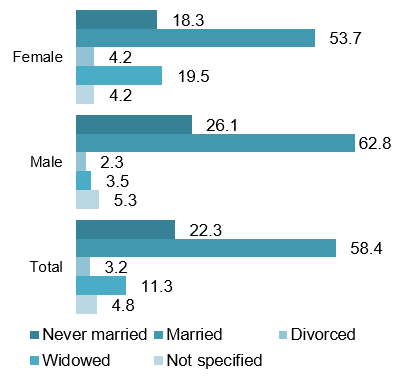
| Female | Male | Total | |
|---|---|---|---|
| Never married | 18.3 | 26.1 | 22.3 |
| Married | 53.7 | 62.8 | 58.4 |
| Widowed | 19.5 | 3.5 | 11.3 |
| Divorced | 4.2 | 2.3 | 3.2 |
| Not specified | 4.2 | 5.3 | 4.8 |
Figure 8: Total population (12 years and above) by marital status (in percentage)
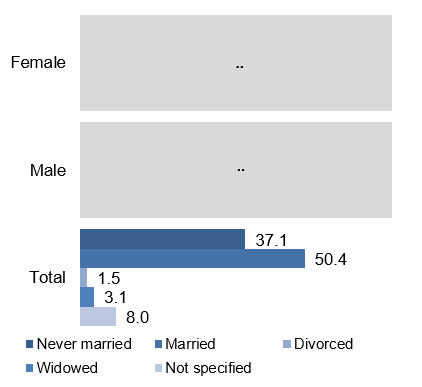
| Total | |
|---|---|
| Never married | 37.1 |
| Married | 50.4 |
| Widowed | 3.1 |
| Divorced | 1.5 |
| Not specified | 8.0 |
Persons with disabilities (6 years and above) by educational attainment (in percentage)
| Female | Male | Total | |||||||
|---|---|---|---|---|---|---|---|---|---|
| No qualification | 48.1 | 38.9 | 42.2 | ||||||
| Primary | 22.1 | 24.5 | 23.7 | ||||||
| Secondary | 12.8 | 11.3 | 11.8 | ||||||
| Above secondary | 6.1 | 6.5 | 6.3 | ||||||
| Khalwa | 6.0 | 15.0 | 11.8 | ||||||
| Not specified | 4.8 | 3.9 | 4.2 | ||||||
Total population (6 years and above) by educational attainment (in percentage)
| Female | Male | Total | |||||||
|---|---|---|---|---|---|---|---|---|---|
| No qualification | 8.7 | 8.0 | 8.3 | ||||||
| Below primary | 43.8 | 41.7 | 42.6 | ||||||
| Primary | 14.9 | 14.8 | 14.8 | ||||||
| Intermediate | 4.5 | 5.1 | 4.9 | ||||||
| Secondary | 13.1 | 12.7 | 12.8 | ||||||
| Diploma / post-secondary | 0.9 | 1.2 | 1.1 | ||||||
| University / first degree | 5.0 | 4.5 | 4.7 | ||||||
| Diploma / higher studies | 0.3 | 0.3 | 0.3 | ||||||
| Master | 0.2 | 0.3 | 0.2 | ||||||
| Doctorate | 0.1 | 0.1 | 0.1 | ||||||
| Khalwa | 4.5 | 7.5 | 6.2 | ||||||
| Not specified | 4.2 | 3.8 | 4.0 | ||||||
Figure 9: Persons with disabilities (10 years and above) by economic activity (in percentage)2
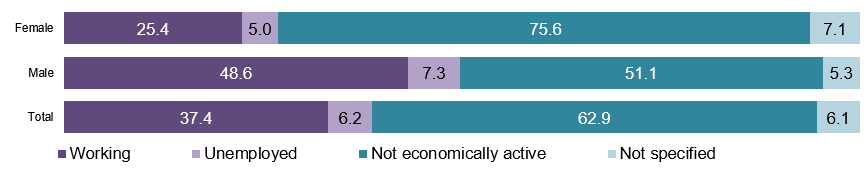
| Female | Male | Total | |
|---|---|---|---|
| Working | 25.4 | 48.6 | 37.4 |
| Unemployed | 5.0 | 7.3 | 6.2 |
| Not economically active | 75.6 | 51.1 | 62.9 |
| Not specified | 7.1 | 5.3 | 6.1 |
Figure 10: Total population (10 years and above) by economic activity (in percentage)
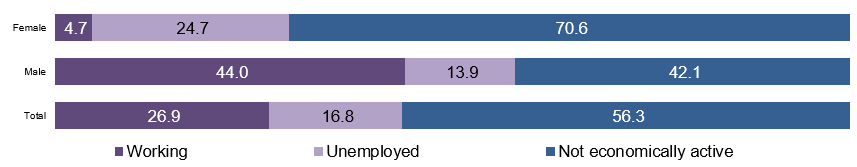
| Female | Male | Total | |
|---|---|---|---|
| Working | 4.7 | 44.0 | 26.9 |
| Unemployed | 24.7 | 13.9 | 16.8 |
| Not economically active | 70.6 | 42.1 | 56.3 |
Source: Central Bureau of Statistics (2008).
| Convention | Signed | 30.3.2007 |
|---|---|---|
| Ratified / Acceded | 24.4.2009 | |
| Optional Protocol | Signed | No |
| Ratified / Acceded | 24.4.2009 |
Source: UN (2014).
| National coordination mechanism: | Name: | National Council for the Disabled |
|---|---|---|
| Year established: | 2010 | |
| Chair: | Minister of Welfare and Social Security | |
| Persons with disabilities represented? | Yes | |
| Additional mechanisms: | System of focal points for disability related matters in line ministries or other governmental institutions | |
| National Authority for Prosthetics | ||
| Articles on disability included in the constitution? | Yes |
|---|---|
| General / overarching national disability law | National Law for the Disabled (2009) |
| National disability strategy / plan | National Council for the Disabled, Five Year Plan (2012-2016) |
Source: ESCWA, based on data collected from government focal points through the ESCWA Questionnaire on the Implementation of the Convention on the Rights of Persons with Disabilities and the Arab Decade for Persons with Disabilities (2013).
Footnotes:
1 The data includes data on South Sudan, as it has been obtained from a census conducted before partition.
2 Persons may report more than one type of disability. For these indicators, persons are counted in each of the relevant categories. For example, persons who report two types of disability are counted twice. Therefore, the sum of the percentages exceeds 100. The percentages have been calculated as follows: Number of persons with disabilities counted in each category / total number of persons with disabilities.