Table of contents:
Lebanon 2004
| HDI: | 0.714 | |||
|---|---|---|---|---|
| Life expectancy at birth: | 71.5 | |||
| GNI: | 9,510 | |||
Source: UNDP.
Figure 1: Persons with disabilities
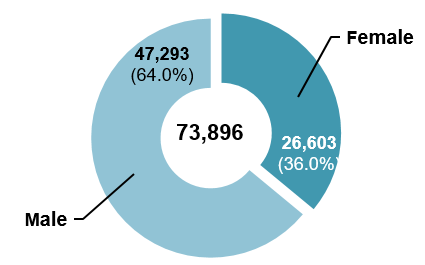
| Female | Male | Total |
|---|---|---|
| 36.0% | 64.0% | 100.0% |
| 26,603 | 47,293 | 73,896 |
Figure 2: Total population

| Female | Male | Total |
|---|---|---|
| 50.2% | 49.8% | 100.0% |
| 1,886,712 | 1,868,322 | 3,755,034 |
Figure 3: Age-specific prevalence of disability (in percentage)
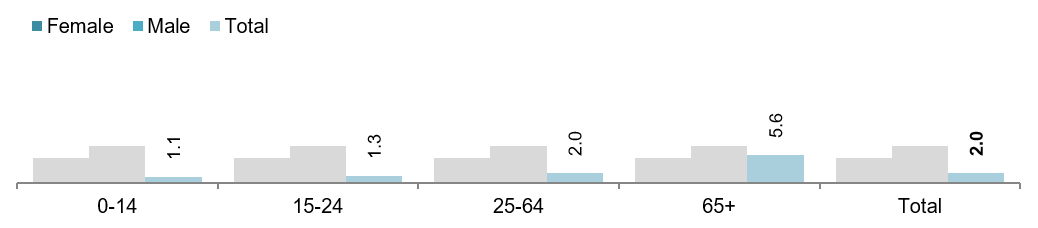
| Total | |
|---|---|
| 0-14 | 1.1 |
| 15-24 | 1.3 |
| 25-64 | 2.0 |
| 65+ | 5.6 |
| Total | 2.0 |
Figure 4: Age distribution of persons with disabilities (in percentage)
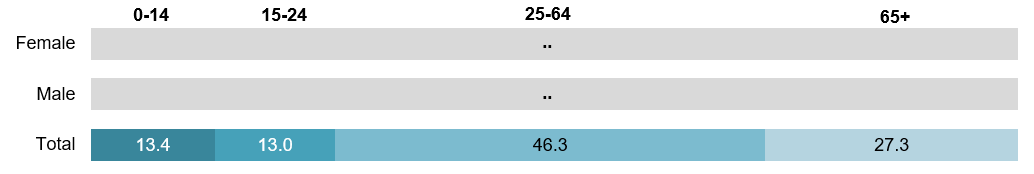
| Total | |
|---|---|
| 0-14 | 13.4 |
| 15-24 | 13.0 |
| 25-64 | 46.3 |
| 65+ | 27.3 |
Type of disability / difficulty (in percentage)2
| Total | |||
|---|---|---|---|
| 59.9 | |||
| Speech / hearing disability | 22.4 | ||
| Visual disability | 16.4 | ||
| Mental disability | 22.3 | ||
Cause of disability / difficulty (in percentage)
| Total | |||
|---|---|---|---|
| Congenital | 30.7 | ||
| Birth-related conditions | 5.1 | ||
| Epidemic disease | 4.3 | ||
| Other types of disease | 12.7 | ||
| Psychological / physical abuse | 0.9 | ||
| Old age | 16.5 | ||
| Injury / accident | 17.7 | ||
| War | 7.9 | ||
| Other | 2.7 | ||
| Not specified | 1.6 | ||
Figure 5: Persons with disabilities (15 years and above) by marital status (in percentage)
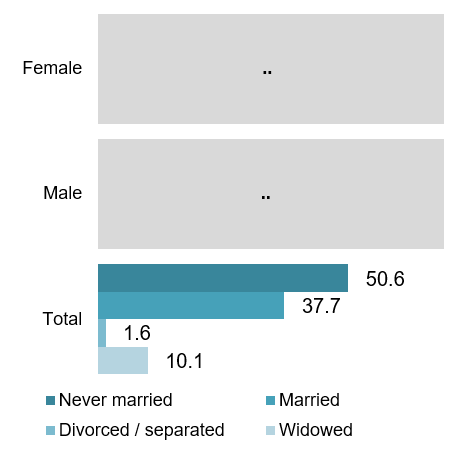
| Total | |
|---|---|
| Never married | 50.6 |
| Married | 37.7 |
| Divorced / separated | 1.6 |
| Widowed | 10.1 |
Figure 6: Total population (15 years and above) by marital status (in percentage)
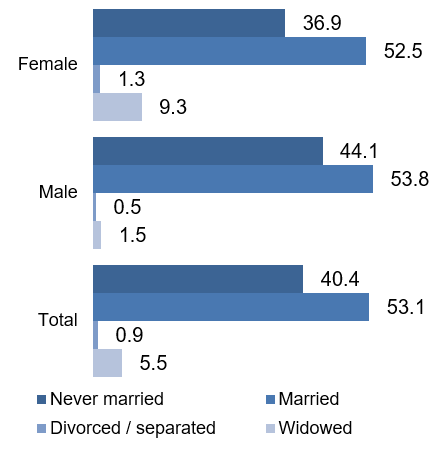
| Female | Male | Total | |
|---|---|---|---|
| Never married | 36.9 | 44.1 | 40.4 |
| Married | 52.5 | 53.8 | 53.1 |
| Widowed | 9.3 | 1.5 | 5.5 |
| Divorced / separated | 1.3 | 0.5 | 0.9 |
Persons with disabilities by educational attainment (in percentage)
| Total | |||
|---|---|---|---|
| Illiterate | 38.2 | ||
| Read and write | 10.2 | ||
| Pre-school | 1.7 | ||
| Primary | 25.1 | ||
| Intermediate | 12.6 | ||
| Secondary | 5.1 | ||
| University | 2.9 | ||
| Intermediate vocational | 2.7 | ||
| Not specified | 0.3 | ||
| Not applicable | 1.3 | ||
Total population (3 years and above) by educational attainment (in percentage)
| Female | Male | Total | |||||||
|---|---|---|---|---|---|---|---|---|---|
| Not enrolled | 0.7 | 0.9 | 0.8 | ||||||
| Illiterate | 11.3 | 5.2 | 8.2 | ||||||
| Pre-school / read and write | 8.2 | 9.4 | 8.8 | ||||||
| Primary | 26.3 | 31.0 | 28.6 | ||||||
| Intermediate | 21.2 | 22.1 | 21.6 | ||||||
| Secondary | 16.8 | 15.5 | 16.2 | ||||||
| University | 15.3 | 15.5 | 15.4 | ||||||
| Not specified | 0.3 | 0.4 | 0.3 | ||||||
Figure 7: Total population (15 years and above) by economic activity (in percentage)
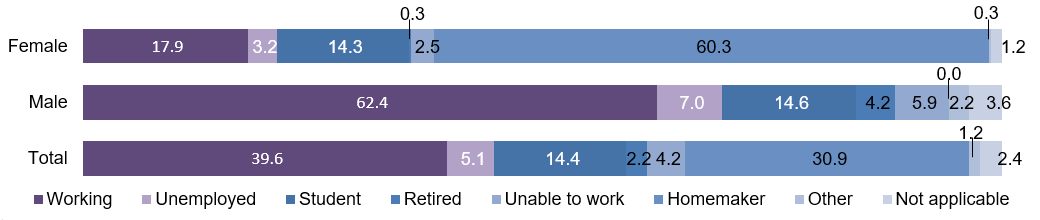
| Female | Male | Total | |
|---|---|---|---|
| Working | 17.9 | 62.4 | 39.6 |
| Unemployed | 3.2 | 7.0 | 5.1 |
| Student | 14.3 | 14.6 | 14.4 |
| Retired | 0.3 | 4.2 | 2.2 |
| Homemaker | 60.3 | 0.0 | 30.9 |
| Unable to work | 2.5 | 5.9 | 4.2 |
| Other | 0.3 | 2.2 | 1.2 |
| Not applicable | 1.2 | 3.6 | 2.4 |
Source: Central Administration of Statistics et al. (2004).
| Convention | Signed | 14.6.2007 |
|---|---|---|
| Ratified / Acceded | No | |
| Optional Protocol | Signed | 14.6.2007 |
| Ratified / Acceded | No |
Source: UN (2014).
| National coordination mechanism: | Name: | National Committee for the Affairs of the Disabled |
|---|---|---|
| Year established: | 1993 | |
| Chair: | Minister of Social Affairs | |
| Persons with disabilities represented? | Yes | |
| Additional mechanisms: | .. | |
NATIONAL DEFINITION OF DISABILITY / PERSONS WITH DISABILITIES
A disabled person is a person who has a decreased ability or has become unable to perform one or more important daily activities, or to attend to their personal needs on their own, or to participate in social activities on an equal basis with others, or to lead a normal personal and social life according to the current standards of the society, due to a loss or functional impairment, be it physical, sensory or mental, total or partial, permanent or temporary, resulting from a congenital disorder, an acquired condition, or a medical condition that lasted beyond normal medical expectations (Law No. 220 on the Rights of Disabled Persons, 2000).
| Articles on disability included in the constitution? | No |
|---|---|
| General / overarching national disability law | Law No. 220 on the Rights of Disabled Persons (2000) |
| National disability strategy / plan | CBD |
Source: ESCWA, based on data collected from government focal points through the ESCWA Questionnaire on the Implementation of the Convention on the Rights of Persons with Disabilities and the Arab Decade for Persons with Disabilities (2013)
Footnotes:
1 Data for these three indicators is from 2005.
2 Persons may report more than one type of disability. For this indicator, persons are counted in each of the relevant categories. For example, persons who report two types of disability are counted twice. Therefore, the sum of the percentages exceeds 100. The percentages have been calculated as follows: Number of persons with disabilities counted in each category / total number of persons with disabilities.