Table of contents:
Qatar 2010(1)
| HDI: | 0.827 | |||
|---|---|---|---|---|
| Life expectancy at birth: | 78.2 | |||
| GNI: | 77,269 | |||
Source: UNDP.
Figure 1: Persons with disabilities

| Female | Male | Total |
|---|---|---|
| 43.7% | 56.3% | 100.0% |
| 3,343 | 4,300 | 7,643 |
Figure 2: Total population
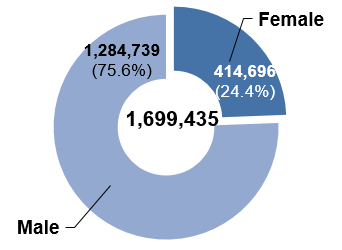
| Female | Male | Total |
|---|---|---|
| 24.4% | 75.6% | 100.0% |
| 414,696 | 1,284,739 | 1,699,435 |
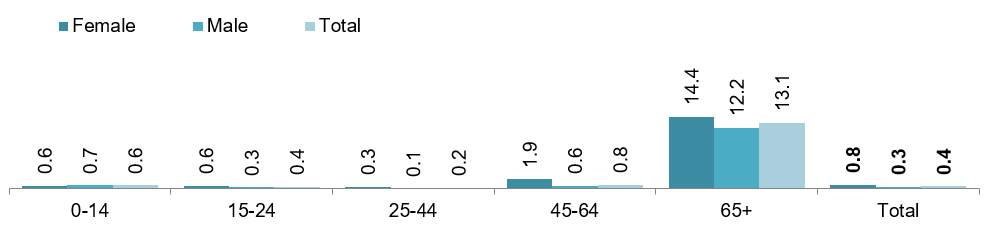
Figure 3: Age-specific prevalence of disability (in percentage)
| Female | Male | Total | |
|---|---|---|---|
| 0-14 | 0.6 | 0.7 | 0.6 |
| 15-24 | 0.6 | 0.3 | 0.4 |
| 25-44 | 0.3 | 0.1 | 0.2 |
| 45-64 | 1.9 | 0.6 | 0.8 |
| 65+ | 14.4 | 12.2 | 13.1 |
| Total | 0.8 | 0.3 | 0.4 |
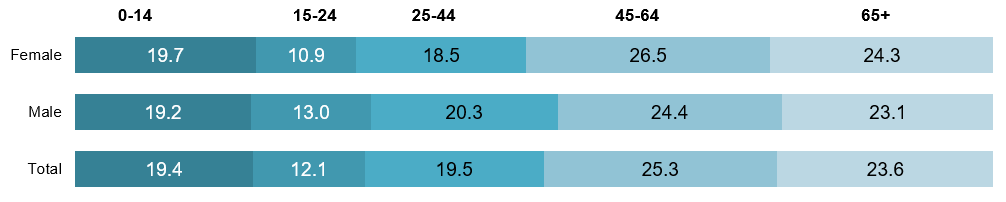
Figure 4: Age distribution of persons with disabilities (in percentage)
| Female | Male | Total | |
|---|---|---|---|
| 0-14 | 19.7 | 19.2 | 19.4 |
| 15-24 | 10.9 | 13.0 | 12.1 |
| 25-44 | 18.5 | 20.3 | 19.5 |
| 45-64 | 26.5 | 24.4 | 25.3 |
| 65+ | 24.3 | 23.1 | 23.6 |
Type of disability / difficulty (in percentage)2
| Female | Male | Total | |||||||
|---|---|---|---|---|---|---|---|---|---|
| Sight | 30.8 | 32.4 | 31.7 | ||||||
| Hearing | 18.3 | 23.0 | 21.0 | ||||||
| Speech | 35.9 | 42.0 | 39.3 | ||||||
| Movement | 48.2 | 41.7 | 44.5 | ||||||
| Remembering | 32.9 | 27.1 | 29.6 | ||||||
| Self Care | 33.7 | 28.6 | 30.8 | ||||||
| Other | 12.1 | 16.3 | 14.5 | ||||||
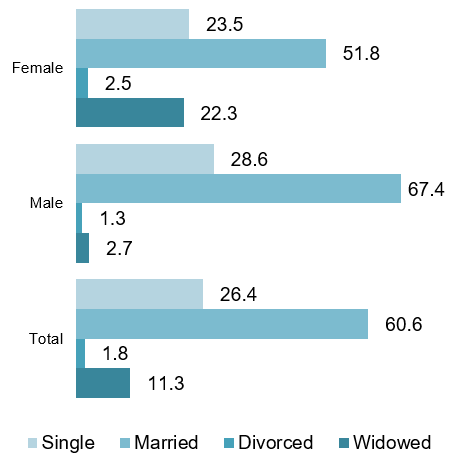
Figure 5: Persons with disabilities (15 years and above) by marital status (in percentage)
| Female | Male | Total | |
|---|---|---|---|
| Widowed | 22.3 | 2.7 | 11.3 |
| Divorced | 2.5 | 1.3 | 1.8 |
| Married | 51.8 | 67.4 | 60.6 |
| Single | 23.5 | 28.6 | 26.4 |
Figure 6: Total population (15 years and above) by marital status (in percentage)
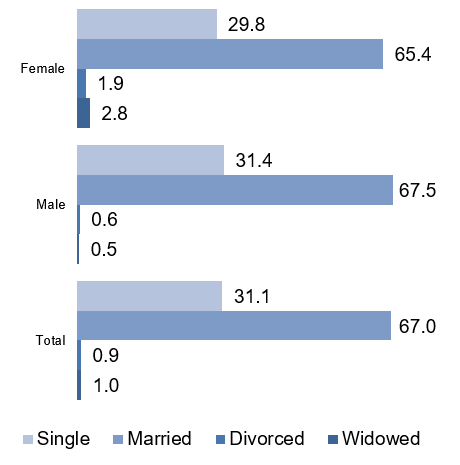
| Female | Male | Total | |
|---|---|---|---|
| Widowed | 2.8 | 0.5 | 1.0 |
| Divorced | 1.9 | 0.6 | 0.9 |
| Married | 65.4 | 67.5 | 67.0 |
| Single | 29.8 | 31.4 | 31.1 |
Persons with disabilities (10 years and above) by educational attainment (in percentage)
| Female | Male | Total | |||||||
|---|---|---|---|---|---|---|---|---|---|
| Illiterate | 33.4 | 20.9 | 26.4 | ||||||
| Read and write | 21.3 | 26.5 | 24.2 | ||||||
| Primary | 12.0 | 13.4 | 12.8 | ||||||
| Preparatory | 7.0 | 9.1 | 8.2 | ||||||
| Vocational training | 0.2 | 1.4 | 0.9 | ||||||
| Secondary | 10.3 | 12.1 | 11.3 | ||||||
| Post secondary diploma | 3.2 | 4.0 | 3.7 | ||||||
| University and above | 11.6 | 11.3 | 11.5 | ||||||
| Other | 1.0 | 1.1 | 1.0 | ||||||
Total population (10 years and above) by educational attainment (in percentage)
| Female | Male | Total | |||||||
|---|---|---|---|---|---|---|---|---|---|
| Illiterate | 4.2 | 3.4 | 3.6 | ||||||
| Read and write | 19.7 | 25.1 | 24.0 | ||||||
| Primary | 15.3 | 24.8 | 22.8 | ||||||
| Preparatory | 12.6 | 11.8 | 11.9 | ||||||
| Vocational training | 0.1 | 1.9 | 1.5 | ||||||
| Secondary | 20.5 | 18.8 | 19.2 | ||||||
| Post secondary diploma | 3.5 | 2.7 | 2.8 | ||||||
| University and above | 24.0 | 11.5 | 14.2 | ||||||
| Other | 0.0 | 0.0 | 0.0 | ||||||
Figure 7: Persons with disabilities (15 years and above) by economic activity (in percentage)
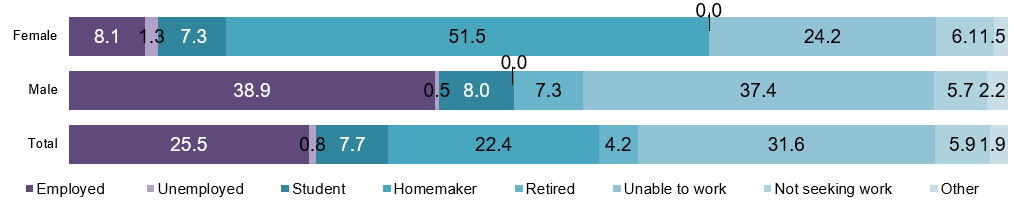
| Female | Male | Total | |
|---|---|---|---|
| Employed | 8.1 | 38.9 | 25.5 |
| Unemployed | 1.3 | 0.5 | 0.8 |
| Student | 7.3 | 8.0 | 7.7 |
| Homemaker | 51.5 | 0.0 | 22.4 |
| Retired | 0.0 | 7.3 | 4.2 |
| Unable to work | 24.2 | 37.4 | 31.6 |
| Not seeking work | 6.1 | 5.7 | 5.9 |
| Other | 1.5 | 2.2 | 1.9 |
Figure 8: Total population (15 years and above) by economic activity (in percentage)
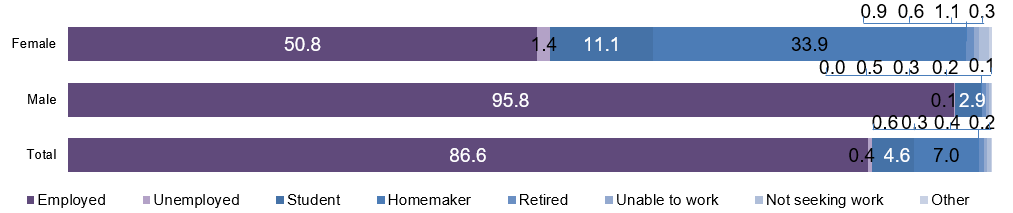
| Female | Male | Total | |
|---|---|---|---|
| Employed | 50.8 | 95.8 | 86.6 |
| Unemployed | 1.4 | 0.1 | 0.4 |
| Student | 11.1 | 2.9 | 4.6 |
| Homemaker | 33.9 | 0.0 | 7.0 |
| Retired | 0.9 | 0.5 | 0.6 |
| Unable to work | 0.6 | 0.3 | 0.3 |
| Not seeking work | 1.1 | 0.2 | 0.4 |
| Other | 0.3 | 0.1 | 0.2 |
Source: Qatar Statistics Authority (2010).
| Convention | Signed | 9.7.2007 |
|---|---|---|
| Ratified / Acceded | 13.5.2008 | |
| Optional Protocol | Signed | 9.7.2007 |
| Ratified / Acceded | No |
Source: UN (2014).
| National coordination mechanism: | Name: | - |
|---|---|---|
| Year established: | - | |
| Chair: | - | |
| Persons with disabilities represented? | - | |
| Additional mechanisms: | System of focal points for disability related matters in line ministries or other governmental institutions | |
NATIONAL DEFINITION OF DISABILITY / PERSONS WITH DISABILITIES
Every person who is permanently incapacitated in whole or in part in any of their senses or physical, psychological or mental abilities, to the extent that his/her capacity for learning, rehabilitation or work is limited (Law No. 2 on Persons with Special Needs, 2004).
| Articles on disability included in the constitution? | No |
|---|---|
| General / overarching national disability law | Law No. 2 on Persons with Special Needs (2004)3 |
| National disability strategy / plan | Social Protection Sector Strategy / Family Cohesion Strategy (2011)4 |
Source: ESCWA, based on data collected from government focal points through the ESCWA Questionnaire on the Implementation of the Convention on the Rights of Persons with Disabilities and the Arab Decade for Persons with Disabilities (2013).
Footnotes:
1 All data pertains to total population (both national and non-national).
2 Persons may report more than one type of disability. For this indicator, persons are counted in each of the relevant categories. For example, persons who report two types of disability are counted twice. Therefore, the sum of the percentages exceeds 100. The percentages have been calculated as follows: Number of persons with disabilities counted in each category / total number of persons with disabilities.
3 New law is currently being developed.
4 This social protection strategy broadly addresses vulnerable groups.