Table of contents:
Kuwait 2011(1)
| HDI: | 0.788 | |||
|---|---|---|---|---|
| Life expectancy at birth: | 74.6 | |||
| GNI: | 51,026 | |||
Source: UNDP.
Figure 1: Persons with disabilities
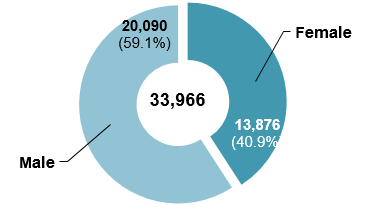
| Female | Male | Total |
|---|---|---|
| 40.9% | 59.1% | 100.0% |
| 13,876 | 20,090 | 33,966 |
Figure 2: Total population
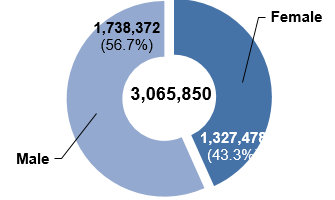
| Female | Male | Total |
|---|---|---|
| 43.3% | 56.7% | 100.0% |
| 1,327,478 | 1,738,372 | 3,065,850 |
Figure 3: Age-specific prevalence of disability (in percentage)
| Female | Male | Total | |
|---|---|---|---|
| 0-14 | 0.9 | 1.2 | 1.0 |
| 15-24 | 0.9 | 1.3 | 1.1 |
| 25-44 | 0.6 | 0.7 | 0.7 |
| 45-64 | 1.6 | 1.6 | 1.6 |
| 65+ | 9.6 | 8.0 | 8.8 |
| Total | 1.0 | 1.2 | 1.1 |
Figure 4: Age distribution of persons with disabilities (in percentage)
| Female | Male | Total | |
|---|---|---|---|
| 0-14 | 21.8 | 20.9 | 21.3 |
| 15-24 | 14.6 | 14.8 | 14.7 |
| 25-44 | 24.1 | 30.9 | 28.1 |
| 45-64 | 20.5 | 21.7 | 21.2 |
| 65+ | 18.9 | 11.6 | 14.6 |
Type of disability / difficulty (in percentage)2
| Female | Male | Total | |||||||
|---|---|---|---|---|---|---|---|---|---|
| Vision difficulty | 21.8 | 24.8 | 23.6 | ||||||
| Hearing difficulties | 6.3 | 6.6 | 6.4 | ||||||
| Speech difficulty | 4.4 | 5.6 | 5.1 | ||||||
| Difficulty in movement | 19.9 | 17.4 | 18.5 | ||||||
| Difficulty in body movement | 10.2 | 7.9 | 8.8 | ||||||
| Difficulty in grasping and moving objects | 3.5 | 3.6 | 3.6 | ||||||
| Difficulty in learning ability | 10.7 | 11.8 | 11.4 | ||||||
| Difficulty in the ability to control one's behavior | 1.9 | 2.3 | 2.1 | ||||||
| Other difficulties | 17.5 | 16.8 | 17.1 | ||||||
| Difficulty in self-care | 3.8 | 3.2 | 3.5 | ||||||
Cause of disability / difficulty (in percentage)
| Female | Male | Total | |||||||
|---|---|---|---|---|---|---|---|---|---|
|
During birth |
39.5 | 39.4 | 39.5 | ||||||
|
Disease |
39.8 | 33.1 | 35.9 | ||||||
|
Hereditary |
6.3 | 6.6 | 6.5 | ||||||
|
Work-related accident |
5.7 | 7.8 | 6.9 | ||||||
|
Road traffic accidents |
1.7 | 4.5 | 3.3 | ||||||
|
Other accidents |
7.1 | 8.6 | 7.9 | ||||||
Figure 5: Persons with disabilities by geographical location
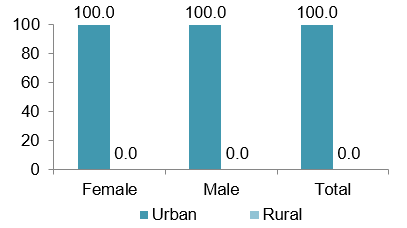
| Female | Male | Total | |
|---|---|---|---|
| Urban | 100.0 | 100.0 | 100.0 |
| Rural | 0.0 | 0.0 | 0.0 |
Figure 6: Total population by geographical location
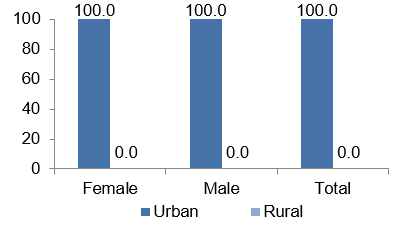
| Female | Male | Total | |
|---|---|---|---|
| Urban | 100.0 | 100.0 | 100.0 |
| Rural | 0.0 | 0.0 | 0.0 |
Figure 7: Persons with disabilities (15 years and above) by marital status (in percentage)
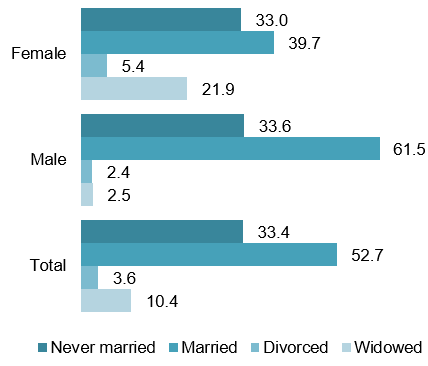
| Female | Male | Total | |
|---|---|---|---|
| Never married | 33.0 | 33.6 | 33.4 |
| Married | 39.7 | 61.5 | 52.7 |
| Divorced | 5.4 | 2.4 | 3.6 |
| Widowed | 21.9 | 2.5 | 10.4 |
Figure 8: Total population (15 years and above) by marital status (in percentage)
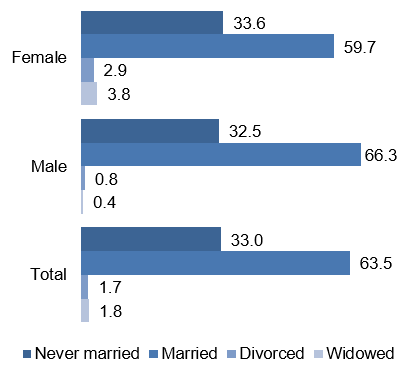
| Female | Male | Total | |
|---|---|---|---|
| Never married | 33.6 | 32.5 | 33.0 |
| Married | 59.7 | 66.3 | 63.5 |
| Divorced | 2.9 | 0.8 | 1.7 |
| Widowed | 3.8 | 0.4 | 1.8 |
Figure 9: Persons with disabilities (15 years and above) by economic activity (in percentage)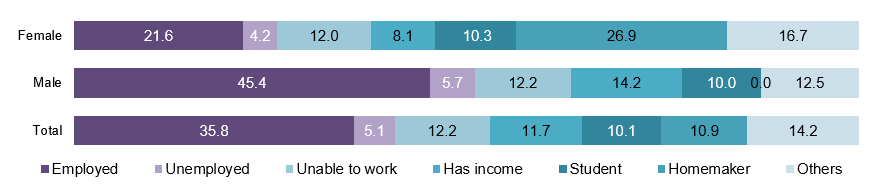
| Female | Male | Total | |
|---|---|---|---|
| Employed | 21.6 | 45.4 | 35.8 |
| Unemployed | 4.2 | 5.7 | 5.1 |
| Student | 10.3 | 10.0 | 10.1 |
| Homemaker | 26.9 | 0.0 | 10.9 |
| Has income | 8.1 | 14.2 | 11.7 |
| Unable to work | 12.0 | 12.2 | 12.2 |
| Others | 16.7 | 12.5 | 14.2 |
Figure 10: Total population (15 years and above) by economic activity (in percentage)3
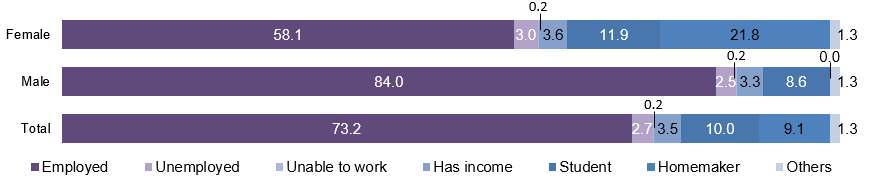
| Female | Male | Total | |
|---|---|---|---|
| Employed | 58.1 | 84.0 | 73.2 |
| Unemployed | 3.0 | 2.5 | 2.7 |
| Student | 11.9 | 8.6 | 10.0 |
| Homemaker | 21.8 | 0.0 | 9.1 |
| Has income | 3.6 | 3.3 | 3.5 |
| Unable to work | 0.2 | 0.2 | 0.2 |
| Others | 1.3 | 1.3 | 1.3 |
Source: Central Statistics Bureau (2011).
| Convention | Signed | No |
|---|---|---|
| Ratified / Acceded | 22.8.2013 | |
| Optional Protocol | Signed | No |
| Ratified / Acceded | No |
Source: UN (2014).
| National coordination mechanism: | Name: | Management of the Welfare of the Disabled / General Authority for Persons with Disabilities |
|---|---|---|
| Year established: | 2010 | |
| Chair: | .. | |
| Persons with disabilities represented? | No | |
| Additional mechanisms: | System of focal points for disability related matters in line ministries or other governmental institutions | |
NATIONAL DEFINITION OF DISABILITY / PERSONS WITH DISABILITIES
Everyone who suffers from permanent total or partial disorders leading to deficiencies in their physical, mental, or sensory abilities, which prevent them from securing the necessities of life or participating fully and effectively in society on an equal basis with others (Law No. 8 on the Rights of Disabled Persons, 2010).
| Articles on disability included in the constitution? | Yes |
|---|---|
| General / overarching national disability law | Law No. 8 on the Rights of Disabled Persons (2010) |
| National disability strategy / plan | .. |
Source: ESCWA, based on data collected from government focal points through the ESCWA Questionnaire on the Implementation of the Convention on the Rights of Persons with Disabilities and the Arab Decade for Persons with Disabilities (2013).
Footnotes:
1 All data pertains to total population (both national and non-national).
2 In this table, "movement" refers to "walking, standing"; "body movement" refers to "bending, kneeling"; "learning ability" refers to "mental difficulties, mental retardation"; "behavior" refers to "psychological, emotional" and "self-care" refers to "bathing, dressing, eating".
3 The category "others" includes persons aged 65 years and above and not employed.