Table of contents:
Morocco 2004
| HDI: | 0.558 | |||
|---|---|---|---|---|
| Life expectancy at birth: | 70.4 | |||
| GNI: | 3,460 | |||
Source: UNDP.
Figure 1: Persons with disabilities
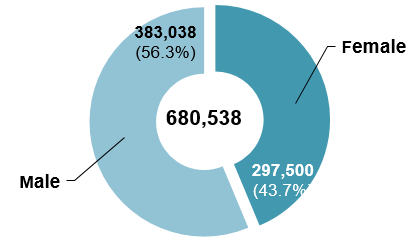
| Female | Male | Total |
|---|---|---|
| 43.7% | 56.3% | 100.0% |
| 297,500 | 383,038 | 680,538 |
Figure 2: Total population
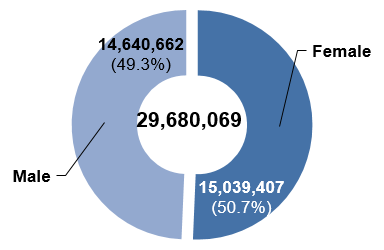
| Female | Male | Total |
|---|---|---|
| 50.7% | 49.3% | 100.0% |
| 15,039,407 | 14,640,662 | 29,680,069 |
Figure 3: Age-specific prevalence of disability (in percentage)
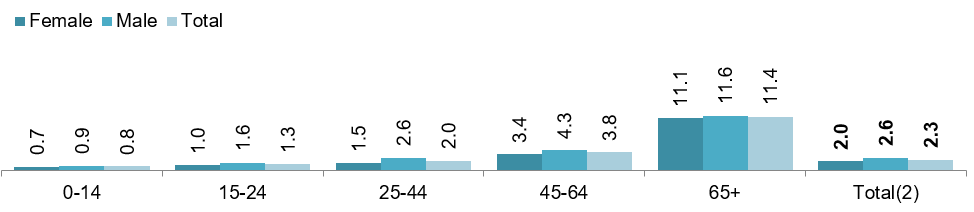
| Female | Male | Total | |
|---|---|---|---|
| 0-14 | 0.7 | 0.9 | 0.8 |
| 15-24 | 1.0 | 1.6 | 1.3 |
| 25-44 | 1.5 | 2.6 | 2.0 |
| 45-64 | 3.4 | 4.3 | 3.8 |
| 65+ | 11.1 | 11.6 | 11.4 |
| Total(2) | 2.0 | 2.6 | 2.3 |
Figure 4: Age distribution of persons with disabilities (in percentage)
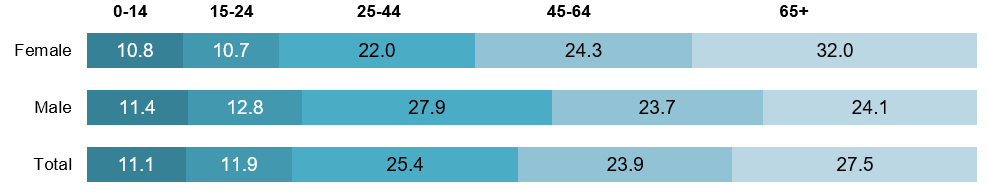
| Female | Male | Total | |
|---|---|---|---|
| 0-14 | 10.8 | 11.4 | 11.1 |
| 15-24 | 10.7 | 12.8 | 11.9 |
| 25-44 | 22.0 | 27.9 | 25.4 |
| 45-64 | 24.3 | 23.7 | 23.9 |
| 65+ | 32.0 | 24.1 | 27.5 |
Type of disability / difficulty (in percentage)
| Total | |||
|---|---|---|---|
| Locomotor | 27.5 | ||
| Chronic | 28.7 | ||
| Sensory | 24.9 | ||
| Mental | 18.8 | ||
Figure 5: Persons with disabilities by geographical location (in percentage)
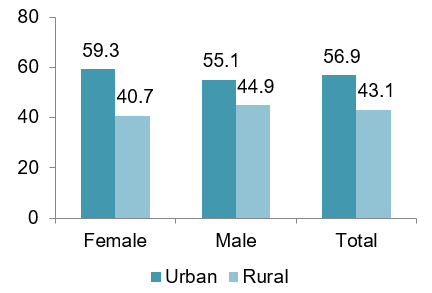
| Female | Male | Total | |
|---|---|---|---|
| Urban | 59.3 | 55.1 | 56.9 |
| Rural | 40.7 | 44.9 | 43.1 |
Figure 6: Total population by geographical location (in percentage)
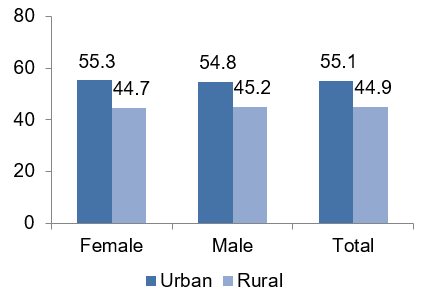
| Female | Male | Total | |
|---|---|---|---|
| Urban | 55.3 | 54.8 | 55.1 |
| Rural | 44.7 | 45.2 | 44.9 |
Figure 7: Persons with disabilities (15 years and above) by marital status (in percentage)
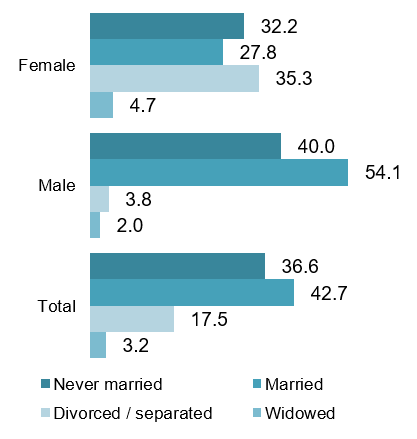
| Female | Male | Total | |
|---|---|---|---|
| Never married | 32.2 | 40.0 | 36.6 |
| Married | 27.8 | 54.1 | 42.7 |
| Widowed | 4.7 | 2.0 | 3.2 |
| Divorced / separated | 35.3 | 3.8 | 17.5 |
Figure 8: Total population (15 years and above) by marital status (in percentage)
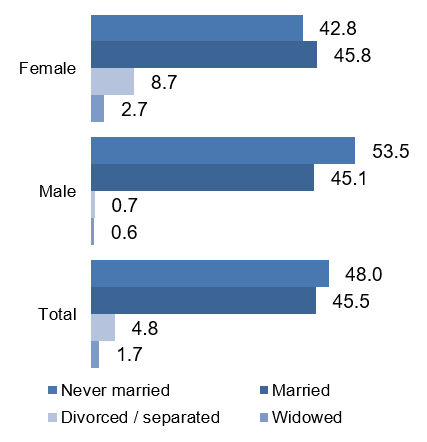
| Female | Male | Total | |
|---|---|---|---|
| Married | 45.8 | 45.1 | 45.5 |
| Never married | 42.8 | 53.5 | 48.0 |
| Divorced / separated | 8.7 | 0.7 | 4.8 |
| Widowed | 2.7 | 0.6 | 1.7 |
Persons with disabilities (10 years and above) by educational attainment (in percentage)
| Total | |||
|---|---|---|---|
| Pre-school | 14.6 | ||
| Basic 1 and 2 | 68.5 | ||
| Secondary | 11.6 | ||
| University and above | 5.3 | ||
Total population (10 years and above) by educational attainment (in percentage)
| Total | |||
|---|---|---|---|
| Pre-school | 4. 7 | ||
| Primary | 46.9 | ||
| Preparatory | 24.5 | ||
| Secondary | 15.2 | ||
| University and above | 8.7 | ||
Figure 9: Persons with disabilities (15 years and above) by economic activity (in percentage)3
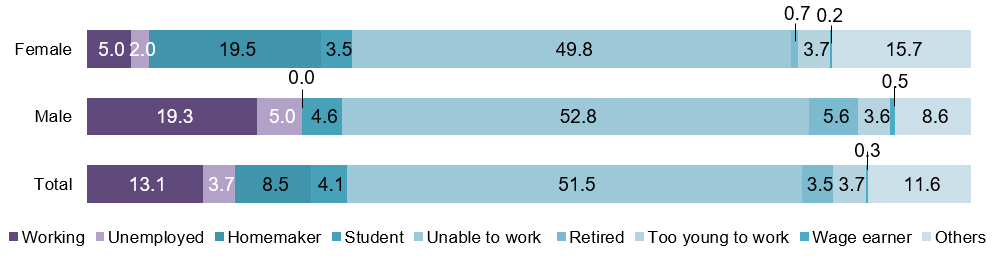
| Female | Male | Total | |
|---|---|---|---|
| Working | 5.0 | 19.3 | 13.1 |
| Unemployed | 2.0 | 5.0 | 3.7 |
| Homeworker | 19.5 | 0.0 | 8.5 |
| Student | 3.5 | 4.6 | 4.1 |
| Too young to work | 3.7 | 3.6 | 3.7 |
| Unable to work | 49.8 | 52.8 | 51.5 |
| Retired | 0.7 | 5.6 | 3.5 |
| Wage earner | 0.2 | 0.5 | 0.3 |
| Others | 15.7 | 8.6 | 11.6 |
Figure 10: Total population (15 years and above) by economic activity (in percentage)
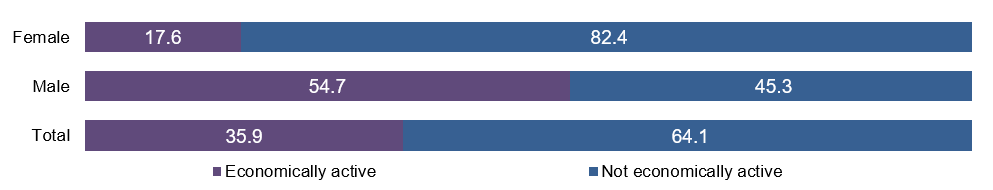
| Female | Male | Total | |
|---|---|---|---|
| Economically active | 17.6 | 54.7 | 35.9 |
| Not economically active | 82.4 | 45.3 | 64.1 |
Sources: Haut-Commissariat Au Plan (2004); Ministry of Solidarity, Women, Family and Social Development (2006).
| Convention | Signed | 30.3.2007 |
|---|---|---|
| Ratified / Acceded | 8.4.2009 | |
| Optional Protocol | Signed | No |
| Ratified / Acceded | 8.4.2009 |
Source: UN (2013).
| National coordination mechanism: | Name: | Directorate of the Advancement of the Rights of Persons with Disability Status , Ministry of Solidarity, Women, Family and Social Development |
|---|---|---|
| Year established: | 1994 | |
| Chair: | Minister of Solidarity and Women, Family and Social Development | |
| Persons with disabilities represented? | Yes | |
| Additional mechanisms: | CBD | |
NATIONAL DEFINITION OF DISABILITY / PERSONS WITH DISABILITIES
According to this law, the disabled signifies every person who is in a state of disability or permanent or temporary hindrance, resulting from a lack or inability that prevents them from performing life functions irrespective of whether the person was born with a disability or became disabled later in life (Social Welfare Act for Disabled People, 1993).4
| Articles on disability included in the constitution? | Yes |
|---|---|
| General / overarching national disability law | Social Welfare Act for Disabled People (1993)5 |
| National disability strategy / plan | National Strategy for the Prevention of Disability (2008)6 |
Source: ESCWA, based on data collected from government focal points through the ESCWA Questionnaire on the Implementation of the Convention on the Rights of Persons with Disabilities and the Arab Decade for Persons with Disabilities (2013).
Footnotes:
1 Data for these three indicators is from 2005.
2 The prevalence rate for persons with disabilities is 5.1 per cent according to the National Survey on Disability (Ministry of Solidarity, Women, Family and Social Development (2006)).
3 Employed persons are aged 7 years and above.
4 A new law on the promotion of the rights of persons with disabilities which includes a new definition of persons with disabilities is pending ratification.
5 Morocco also has an overarching law for persons with visual impairments (Social Welfare Act for Blind and People with Difficulty in Seeing (1982)).
6 A new national disability strategy is currently being developed.