Table of contents:
Iraq 2007
| HDI: | 0.567 | |||
|---|---|---|---|---|
| Life expectancy at birth: | 67.8 | |||
| GNI: | 2,853 | |||
Source: UNDP.
Figure 1: Persons with disabilities
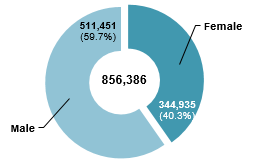
| Female | Male | Total |
|---|---|---|
| 40.3% | 59.7% | 100% |
| 344,935 | 511,451 | 856,386 |
Figure 2: Total population
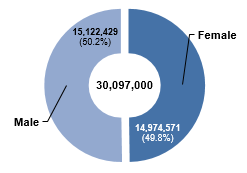
| Female | Male | Total |
|---|---|---|
| 49.8% | 50.2% | 100.0% |
| 14,974,571 | 15,122,429 | 30,097,000 |
Figure 3: Age-specific prevalence of disability (in percentage)
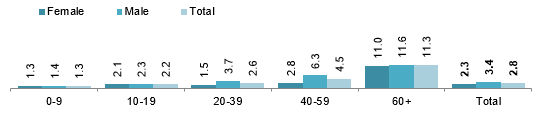
| Female | Male | Total | |
|---|---|---|---|
| 0-9 | 1.3 | 1.4 | 1.3 |
| 10-19 | 2.1 | 2.3 | 2.2 |
| 20-39 | 1.5 | 3.7 | 2.6 |
| 40-59 | 2.8 | 6.3 | 4.5 |
| 60+ | 11.0 | 11.6 | 11.3 |
| Total | 2.3 | 3.4 | 2.8 |
Figure 4: Age distribution of persons with disabilities (in percentage)
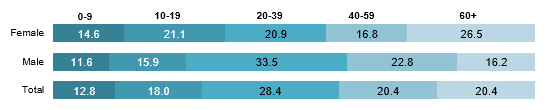
| Female | Male | Total | |
|---|---|---|---|
| 0-9 | 14.6 | 11.6 | 12.8 |
| 10-19 | 21.1 | 15.9 | 18.0 |
| 20-39 | 20.9 | 33.5 | 28.4 |
| 40-59 | 16.8 | 22.8 | 20.4 |
| 60+ | 26.5 | 16.2 | 20.4 |
| Total | 100.0 | 100.0 | 100.0 |
Type of disability / difficulty (in percentage)
| Female | Male | Total | |||||||
|---|---|---|---|---|---|---|---|---|---|
| Blindness | 8.2 | 6.7 | 7.3 | ||||||
| Deafness | 4.0 | 2.5 | 3.1 | ||||||
| Muteness / speech disability | 8.4 | 7.7 | 8.0 | ||||||
| Limp / walking disability / locomotor disability | 42.5 | 46.5 | 44.9 | ||||||
| Mental retardation | 16.9 | 13.1 | 14.6 | ||||||
| Multiple disabilities | 5.2 | 6.5 | 6.0 | ||||||
| Other | 14.9 | 17.0 | 16.1 | ||||||
Cause of disability / difficulty (in percentage)
| Female | Male | Total | |||||||
|---|---|---|---|---|---|---|---|---|---|
| Since birth | 51.0 | 42.2 | 45.6 | ||||||
| Work-related accident | 1.6 | 5.0 | 3.7 | ||||||
| Work-related disease | 1.0 | 1.8 | 1.5 | ||||||
| Chemical strike / depleted uranium | 0.4 | 0.0 | 0.2 | ||||||
| Armed civil unrest | 0.6 | 2.8 | 2.0 | ||||||
| War | 2.7 | 16.3 | 11.0 | ||||||
| Non work-related disease | 18.2 | 11.3 | 14.0 | ||||||
| Traffic accident | 2.7 | 5.9 | 4.7 | ||||||
| Other | 21.5 | 12.8 | 16.2 | ||||||
| Land mines | 0.2 | 1.8 | 1.1 | ||||||
Figure 5: Persons with disabilities by geographical location (in percentage)
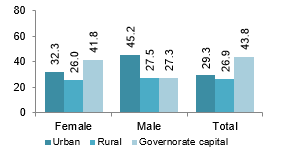
| Female | Male | Total | |
|---|---|---|---|
| Urban | 32.3 | 45.2 | 29.3 |
| Rural | 26.0 | 27.5 | 26.9 |
| Governorate capital | 41.8 | 27.3 | 43.8 |
Figure 6: Total population by geographical location (in percentage)
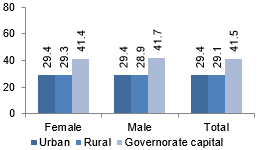
| Female | Male | Total | |
|---|---|---|---|
| Urban | 29. | 29.4 | 29.4 |
| Rural | 29.3 | 28.9 | 29.1 |
| Governorate capital | 41.4 | 41.7 | 41.5 |
Figure 7: Persons with disabilities (12 years and above) by marital status (percentage)
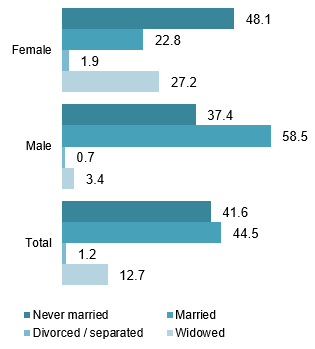
| Female | Male | Total | |
|---|---|---|---|
| Never married | 48.1 | 37.4 | 41.6 |
| Married | 22.8 | 58.5 | 44.5 |
| Divorced / separated | 1.9 | 0.7 | 1.2 |
| Widowed | 27.2 | 3.4 | 12.7 |
Figure 8: Total population (12 years and above) by marital status (percentage)
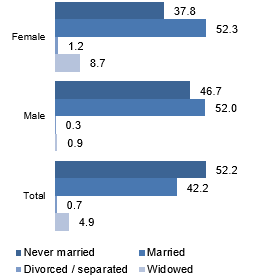
| Female | Male | Total | |
|---|---|---|---|
| Married | 52.3 | 52 | 42.2 |
| Never married | 37.8 | 46.7 | 52.2 |
| Divorced / separated | 1.2 | 0.3 | 0.7 |
| Widowed | 8.7 | 0.9 | 4.9 |
Persons with disabilities by educational attainment (in percentage)
| Female | Male | Total | |||||||
|---|---|---|---|---|---|---|---|---|---|
| Illiterate | 66.0 | 41.3 | 51.2 | ||||||
| Read only | 2.8 | 3.7 | 3.3 | ||||||
| Read and write | 9.0 | 15.6 | 12.9 | ||||||
| Primary | 8.6 | 19.8 | 15.3 | ||||||
| Intermediate | 2.1 | 6.4 | 4.7 | ||||||
| Secondary / vocational | 0.7 | 3.7 | 2.5 | ||||||
| Technical diploma | 1.1 | 1.6 | 1.4 | ||||||
| Bachelor and above | 0.6 | 1.7 | 1.3 | ||||||
| Other | 0.1 | 0.1 | 0.1 | ||||||
| Not specified | 0.4 | 0.2 | 0.3 | ||||||
| Under 6 years of age | 8.7 | 5.9 | 7.0 | ||||||
Total population by educational attainment (in percentage)
| Female | Male | Total | |||||||
|---|---|---|---|---|---|---|---|---|---|
| Illiterate | 23.3 | 12.1 | 17.7 | ||||||
| Read only | 6.2 | 7.1 | 6.7 | ||||||
| Read and write | 17.0 | 17.2 | 17.1 | ||||||
| Primary | 20.7 | 21.5 | 21.1 | ||||||
| Intermediate | 7.0 | 9.8 | 8.4 | ||||||
| Secondary / vocational | 3.7 | 6.3 | 5.0 | ||||||
| Technical diploma | 2.8 | 3.8 | 3.3 | ||||||
| Bachelor and above | 2.3 | 4.0 | 3.2 | ||||||
| Other | 0.0 | 0.0 | 0.0 | ||||||
| Not specified | 0.3 | 0.2 | 0.2 | ||||||
| Under 6 years of age | 16.7 | 17.9 | 17.3 | ||||||
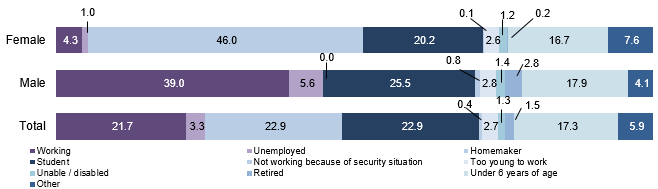
Figure 9: Total population (6 years and above) by economic activity (in percentage)
>
| Female | Male | Total | |
|---|---|---|---|
| Working | 4.3 | 39.0 | 21.7 |
| Unemployed | 1.0 | 5.6 | 3.3 |
| Homemaker | 46.0 | 0.0 | 22.9 |
| Student | 20.2 | 25.5 | 22.9 |
| Too young to work | 2.6 | 2.8 | 2.7 |
| Retired | 0.2 | 2.8 | 1.5 |
| Unable / disabled | 1.2 | 1.4 | 1.3 |
| Not working because of security situation | 0.1 | 0.8 | 0.4 |
| Other | 7.6 | 4.1 | 5.9 |
| Under 6 years of age | 16.7 | 17.9 | 17.3 |
Source: Central Organization for Statistics and Information Technology (2007).
| Convention | Signed | No |
|---|---|---|
| Ratified / Acceded | 20.3.2013 | |
| Optional Protocol | Signed | No |
| Ratified / Acceded | No |
Source: UN (2014).
| National coordination mechanism: | Name: | - |
|---|---|---|
| Year established: | - | |
| Chair: | - | |
| Persons with disabilities represented? | - | |
| Additional mechanisms: | System of focal points for disability related matters in line ministries or other governmental institutions | |
NATIONAL DEFINITION OF DISABILITY / PERSONS WITH DISABILITIES
Disability: any restriction or inability to interact with the environment within the limits of what is considered normal due to an impairment or deficiency. Persons with disabilities: every person who has lost their ability, totally or partially, to participate in community life on the same basis as others, as a result of a physical or mental or sensory impairment that has led to an inability to perform certain functions (Law No. 38 on the Welfare of Persons with Disabilities and Special Needs, 2013).
| Articles on disability included in the constitution? | Yes |
|---|---|
| General / overarching national disability law | Law No. 38 on the Welfare of Persons with Disabilities and Special Needs (2013) |
| National disability strategy / plan | No |
Source: ESCWA, based on data collected from government focal points through the ESCWA Questionnaire on the Implementation of the Convention on the Rights of Persons with Disabilities and the Arab Decade for Persons with Disabilities (2013).