Table of contents:
Jordan 2010
| HDI: | 0.699 | |||
|---|---|---|---|---|
| Life expectancy at birth: | 73.3 | |||
| GNI: | 5,235 | |||
Source: UNDP.
Figure 1: Persons with disabilities1
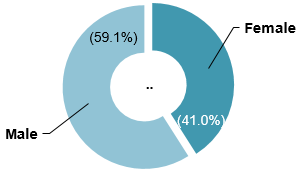
| Female | Male |
|---|---|
| 41.0% | 59.1% |
Figure 2: Total population1
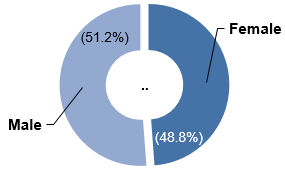
| Female | Male |
|---|---|
| 48.8% | 51.2% |
Figure 3: Age-specific prevalence of disability (in percentage)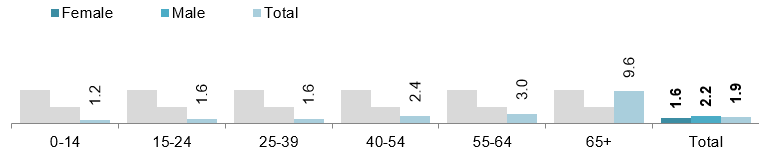
| Female | Male | Total | |
|---|---|---|---|
| 0-14 | .. | .. | 1.2 |
| 15-24 | .. | .. | 1.6 |
| 25-39 | .. | .. | 1.6 |
| 40-54 | .. | .. | 2.4 |
| 55-64 | .. | .. | 3.0 |
| 65+ | .. | .. | 9.6 |
| Total | 1.6 | 2.2 | 1.9 |
Type of disability / difficulty (in percentage)
| Female | Male | Total | |
|---|---|---|---|
| Mental | 6.1 | 9.2 | 7.9 |
| Locomotor | 18.2 | 16.6 | 17.3 |
| Autism | 0 | 0.9 | 0.5 |
| Cerebral palsy | 5.9 | 5.7 | 5.8 |
| Hearing | 3.8 | 4.6 | 4.3 |
| Learning difficulties | 2.9 | 1.5 | 2.1 |
| Hearing loss | 5.8 | 5.3 | 5.5 |
| Speech and language | 3.5 | 3.3 | 3.4 |
| Deaf and blind | 3.6 | 2.9 | 3.2 |
| Psychological disorders | 3 | 6.6 | 5.2 |
| Visual | 4.8 | 5.4 | 5.2 |
| Brain injuries | 3.3 | 4.9 | 4.3 |
| Loss of vision | 15.9 | 16.5 | 16.2 |
| Physical and health | 15.5 | 8.1 | 11.2 |
| Multiple disabilities | 7.6 | 8.6 | 8.2 |
Figure 4: Persons with disabilities by geographical location (in percentage)
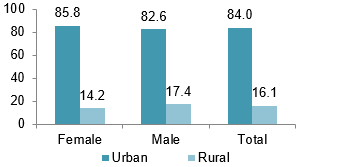
| Female | Male | Total | |
|---|---|---|---|
| Urban | 85.8 | 82.6 | 84.0 |
| Rural | 14.2 | 17.4 | 16.1 |
Figure 5: Total population by geographical location (in percentage)
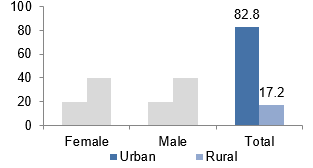
| Female | Male | Total | |
|---|---|---|---|
| Urban | 20.0 | 20.0 | 82.8 |
| Rural | 40.0 | 40.0 | 17.2 |
Figure 6: Persons with disabilities (15 years and above) by marital status (in percentage)2
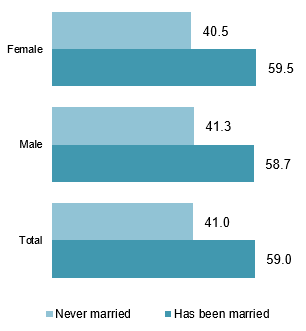
| Female | Male | Total | |
|---|---|---|---|
| Has been married | 59.5 | 58.7 | 59.0 |
| Never married | 40.5 | 41.3 | 41.0 |
Figure 7: Total population (15 years and above) by marital status (in percentage)2
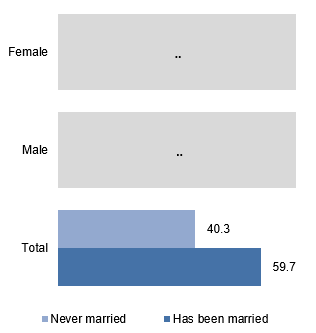
| Total | |
|---|---|
| Has been married | 59.7 |
| Never married | 40.3 |
Persons with disabilities (10 years and above) by educational attainment (in percentage)
| Female | Male | Total | |
|---|---|---|---|
| Illiterate / Read only / Read and write | 40 | 32 | 35.3 |
| Below secondary | 43.5 | 47.3 | 45.7 |
| Secondary | 8.5 | 10.7 | 9.8 |
| Intermediate diploma | 3.8 | 3.9 | 3.9 |
| Bachelor and above | 4.2 | 6.1 | 5.3 |
Total population (10 years and above) by educational attainment (in percentage)
| Total | |
|---|---|
| Illiterate / read only / read and write | 11 |
| Below secondary | 49.3 |
| Secondary | 17.8 |
| Intermediate diploma | 8.1 |
| Bachelor and above | 13.8 |
Figure 8: Persons with disabilities (15 years and above) by economic activity (in percentage)
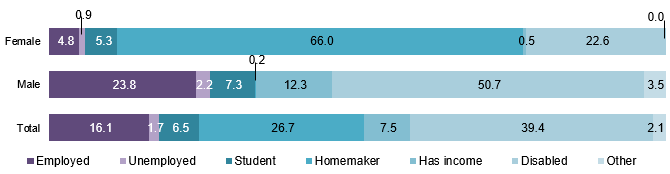
| Female | Male | Total | |
|---|---|---|---|
| Employed | 4.8 | 23.8 | 16.1 |
| Unemployed | 0.9 | 2.2 | 1.7 |
| Student | 5.3 | 7.3 | 6.5 |
| Homemaker | 66.0 | 0.2 | 26.7 |
| Has income | 0.5 | 12.3 | 7.5 |
| Disabled | 22.6 | 50.7 | 39.4 |
| Other | 0.0 | 3.5 | 2.1 |
Figure 9: Total population (15 years and above) by economic activity (in percentage)
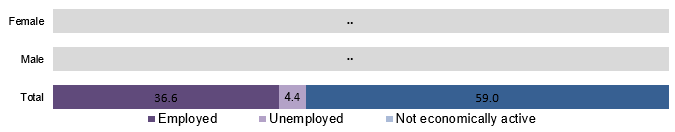
| Total | |
|---|---|
| Employed | 36.6 |
| Unemployed | 4.4 |
| Not economically active | 59.0 |
Source: Department of Statistics of Jordan (2010).
| Convention | Signed | 30.3.2007 |
|---|---|---|
| Ratified / Acceded | 31.3.2008 | |
| Optional Protocol | Signed | 30.3.2007 |
| Ratified / Acceded | No |
Source: UN (2014)
| National coordination mechanism: | Name: | Higher Council for the Affairs of Persons with Disabilities |
|---|---|---|
| Year established: | 2007 | |
| Chair: | Prince Raad Bin Zaid Al Moazzam | |
| Persons with disabilities represented? | Yes | |
| Additional mechanisms: | System of focal points for disability related matters in line ministries or other governmental institutions | |
| National Centre for Human Rights | ||
| Jordanian Coalition for Persons with Disabilities | ||
NATIONAL DEFINITION OF DISABILITY / PERSONS WITH DISABILITIES
The disabled signifies every person suffering from a permanent partial or total impairment affecting any of their senses, or their physical, psychological or mental capabilities, to an extent that it undermines their ability to learn, work, or be rehabilitated, and in a way that renders them unable to meet their normal day-to-day requirements under conditions similar to those of non-disabled persons (Law No. 31 on the Rights of Persons with Disabilities, 2007).
| Articles on disability included in the constitution? | Yes |
|---|---|
| General / overarching national disability law | Law No. 31 on the Rights of Persons with Disabilities (2007)3 |
| National disability strategy / plan | National Strategy for Persons with Disabilities (2007) |
Source: ESCWA, based on data collected from government focal points through the ESCWA Questionnaire on the Implementation of the Convention on the Rights of Persons with Disabilities and the Arab Decade for Persons with Disabilities (2013).
Footnotes:
1 Data on the total number of persons with disabilities and total number of population is not available in the source. Data on the sample size is available from the source below.
2 The category "has been married" includes those who are divorced, separated, single and widowed.
3 The law is currently being amended.