Table of contents:
Palestine 2007
| HDI: | 0.662 | |||
|---|---|---|---|---|
| Life expectancy at birth: | 72.1 | |||
| GNI: | 2,630 | |||
Sources: UNDP.
Figure 1: Persons with disabilities
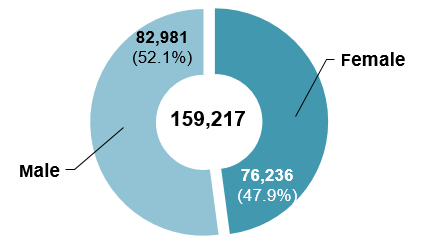
| Female | Male | Total |
|---|---|---|
| 47.9% | 52.1% | 100.0% |
| 76,236 | 82,981 | 159,217 |
Figure 2: Total population
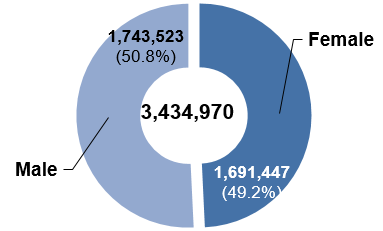
| Female | Male | Total |
|---|---|---|
| 49.2% | 50.8% | 100.0% |
| 1,691,447 | 1,743,523 | 3,434,970 |
Figure 3: Age-specific prevalence of disability (in percentage)2
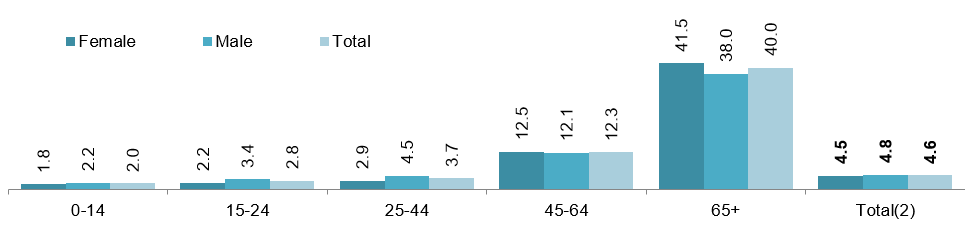
| Female | Male | Total | |
|---|---|---|---|
| 0-14 | 1.8 | 2.2 | 2.0 |
| 15-24 | 2.2 | 3.4 | 2.8 |
| 25-44 | 2.9 | 4.5 | 3.7 |
| 45-64 | 12.5 | 12.1 | 12.3 |
| 65+ | 41.5 | 38.0 | 40.0 |
| Total(2) | 4.5 | 4.8 | 4.6 |
Figure 4: Age distribution of persons with disabilities (in percentage)
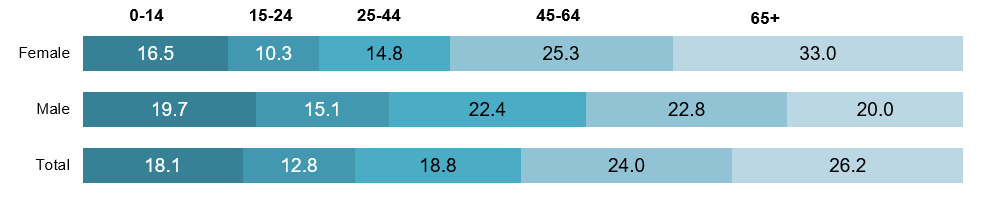
| Female | Male | Total | |
|---|---|---|---|
| 0-14 | 16.5 | 19.7 | 18.1 |
| 15-24 | 10.3 | 15.1 | 12.8 |
| 25-44 | 14.8 | 22.4 | 18.8 |
| 45-64 | 25.3 | 22.8 | 24.0 |
| 65+ | 33.0 | 20.0 | 26.2 |
Type of disability / difficulty (in percentage)3
| Female | Male | Total | |||||||
|---|---|---|---|---|---|---|---|---|---|
| Sight | 56.9 | 51.6 | 54.1 | ||||||
| Hearing | 26.8 | 25.2 | 26.0 | ||||||
| Movement | 42.1 | 36.1 | 38.9 | ||||||
| Understanding and cognition | 13.9 | 15.2 | 14.6 | ||||||
| Communication | 13.8 | 15.6 | 14.7 | ||||||
Figure 5: Persons with disabilities by geographical location (in percentage)
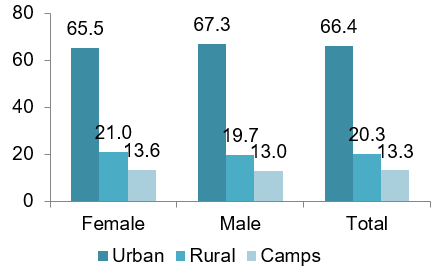
| Female | Male | Total | |
|---|---|---|---|
| Urban | 65.5 | 67.3 | 66.4 |
| Rural | 21.0 | 19.7 | 20.3 |
| Camps | 13.6 | 13.0 | 13.3 |
Figure 6: Total population by geographical location (in percentage)
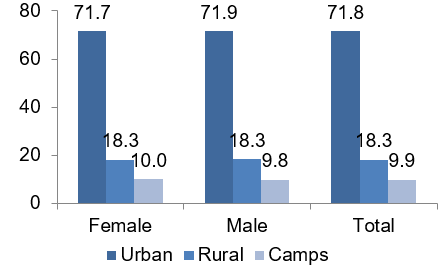
| Female | Male | Total | |
|---|---|---|---|
| Urban | 71.7 | 71.9 | 71.8 |
| Rural | 18.3 | 18.3 | 18.3 |
| Camps | 10.0 | 9.8 | 9.9 |
Figure 7: Persons with disabilities (12 years and above) by marital status (in percentage)
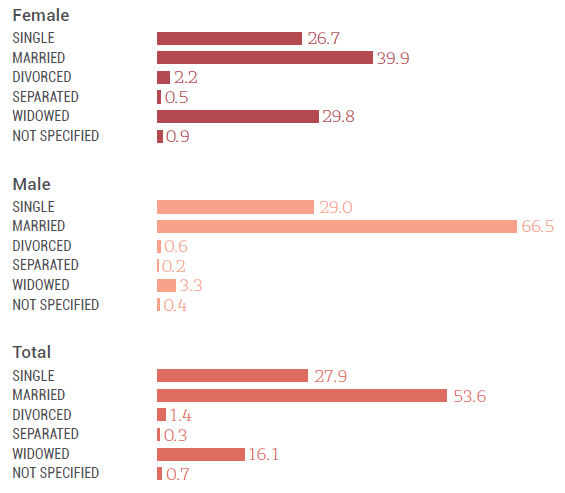
| Female | Male | Total | |
|---|---|---|---|
| Single | 26.7 | 29.0 | 27.9 |
| Married | 39.9 | 66.5 | 53.6 |
| Divorced | 2.2 | 0.6 | 1.4 |
| Widowed | 29.8 | 3.3 | 16.1 |
| Separated | 0.5 | 0.2 | 0.3 |
| Not specified | 0.9 | 0.4 | 0.7 |
Figure 8: Total population (12 years and above) by marital status (in percentage)
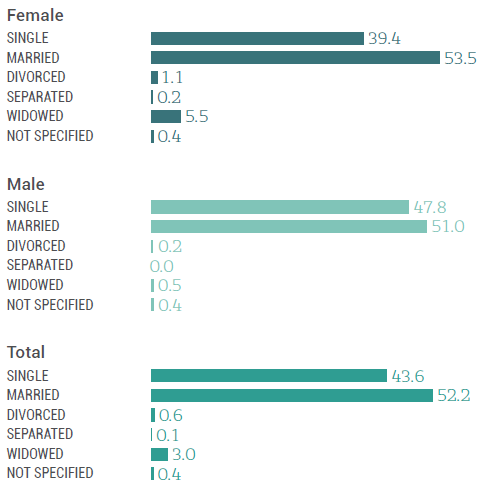
| Female | Male | Total | |
|---|---|---|---|
| Single | 39.4 | 47.8 | 43.6 |
| Married | 53.5 | 51.0 | 52.2 |
| Divorced | 1.1 | 0.2 | 0.6 |
| Widowed | 5.5 | 0.5 | 3.0 |
| Separated | 0.2 | 0.0 | 0.1 |
| Not specified | 0.4 | 0.4 | 0.4 |
Persons with disabilities (10 years and above) by educational attainment (in percentage)
| Female | Male | Total | |||||||
|---|---|---|---|---|---|---|---|---|---|
| Illiterate | 48.3 | 19.5 | 33.4 | ||||||
| Read and write | 14.5 | 19.9 | 17.3 | ||||||
| Primary | 15.3 | 23.0 | 19.3 | ||||||
| Preparatory | 12.0 | 19.1 | 15.6 | ||||||
| Secondary | 6.3 | 10.5 | 8.4 | ||||||
| Intermediate diploma | 1.8 | 3.3 | 2.6 | ||||||
| Bachelor | 1.6 | 4.0 | 2.8 | ||||||
| Higher diploma | 0.0 | 0.1 | 0.1 | ||||||
| Master | 0.1 | 0.4 | 0.2 | ||||||
| Doctorate | 0.0 | 0.1 | 0.1 | ||||||
| Not specified | 0.2 | 0.1 | 0.2 | ||||||
Total population (10 years and above) by educational attainment (in percentage)
| Female | Male | Total | |||||||
|---|---|---|---|---|---|---|---|---|---|
| Illiterate | 8.4 | 2.8 | 5.6 | ||||||
| Read and write | 12.7 | 13.3 | 13.0 | ||||||
| Primary | 22.9 | 24.9 | 23.9 | ||||||
| Preparatory | 27.1 | 28.0 | 27.6 | ||||||
| Secondary | 18.2 | 17.6 | 17.9 | ||||||
| Intermediate diploma | 3.9 | 3.9 | 3.9 | ||||||
| Bachelor | 6.5 | 8.1 | 7.3 | ||||||
| Higher diploma | 0.1 | 0.2 | 0.1 | ||||||
| Master | 0.2 | 0.9 | 0.6 | ||||||
| Doctorate | 0.0 | 0.3 | 0.2 | ||||||
| Not specified | 0.1 | 0.1 | 0.1 | ||||||
Figure 9: Persons with disabilities (10 years and above) by economic activity (in percentage)
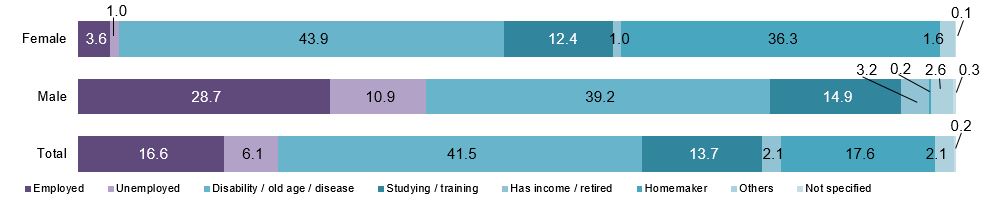
| Female | Male | Total | |
|---|---|---|---|
| Employed | 3.6 | 28.7 | 16.6 |
| Unemployed | 1.0 | 10.9 | 6.1 |
| Studying / training | 12.4 | 14.9 | 13.7 |
| Homemaker | 36.3 | 0.2 | 17.6 |
| Disability / old age / disease | 43.9 | 39.2 | 41.5 |
| Has income / retired | 1.0 | 3.2 | 2.1 |
| Others | 1.6 | 2.6 | 2.1 |
| Not specified | 0.1 | 0.3 | 0.2 |
Figure 10: Total population (10 years and above) by economic activity (in percentage)
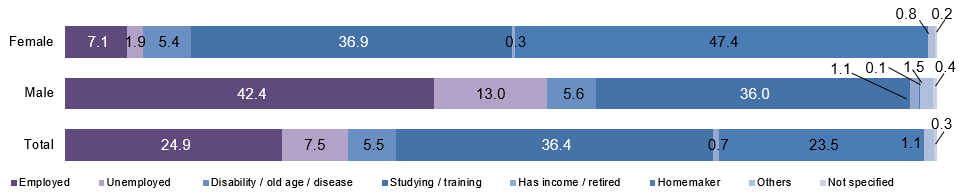
| Female | Male | Total | |
|---|---|---|---|
| Employed | 7.1 | 42.4 | 24.9 |
| Unemployed | 1.9 | 13.0 | 7.5 |
| Studying / training | 36.9 | 36.0 | 36.4 |
| Homemaker | 47.4 | 0.1 | 23.5 |
| Disability / old age / disease | 5.4 | 5.6 | 5.5 |
| Has income / retired | 0.3 | 1.1 | 0.7 |
| Others | 0.8 | 1.5 | 1.1 |
| Not specified | 0.2 | 0.4 | 0.3 |
Sources: Palestinian Central Bureau of Statistics (2007); Palestinian Central Bureau of Statistics and Ministry of Social Affairs (2011).
| Convention | Signed | No |
|---|---|---|
| Ratified / Acceded | 2.4.2014 | |
| Optional Protocol | Signed | No |
| Ratified / Acceded | No |
Source: UN (2014).
| National coordination mechanism: | Name: | Supreme Council for the Affairs of Persons with Disabilities |
|---|---|---|
| Year established: | 2004 | |
| Chair: | Minister of Social Affairs | |
| Persons with disabilities represented? | Yes | |
| Additional mechanisms: | System of focal points for disability related matters in line ministries or other governmental institutions | |
| General Union of the Disabled | ||
| Articles on disability included in the constitution? | Yes |
|---|---|
| General / overarching national disability law | Law No. 4 on the Rights of the Disabled (1999) |
| National disability strategy / plan | National Strategic Plan for the Disability Sector (2012) |
Source: ESCWA, based on data collected from government focal points through the ESCWA Questionnaire on the Implementation of the Convention on the Rights of Persons with Disabilities and the Arab Decade for Persons with Disabilities (2013)
Footnotes:
1 Data on HDI is from 2010. Data on life expectancy and GNI is from 2007.
2 The prevalence rate of persons with disabilities is 2.7 per cent according to the Disability Survey (Palestinian Central Bureau of Statistics and Ministry of Social Affairs (2011)).
3 Persons may report more than one type of disability. For this indicator, persons are counted in each of the relevant categories. For example, persons who report two types of disability are counted twice. Therefore, the sum of the percentages exceeds 100. The percentages have been calculated as follows: Number of persons with disabilities counted in each category / total number of persons with disabilities.