Table of contents:
Libya 2007(1)
| HDI: | 0.760 | |||
|---|---|---|---|---|
| Life expectancy at birth: | 73.9 | |||
| GNI: | 15,552 | |||
Source: UNDP.
Figure 1:Total population2
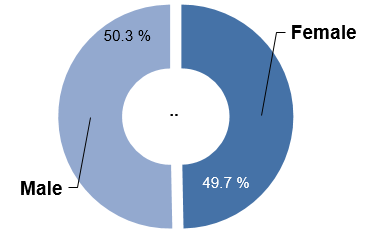
| Female | Male |
|---|---|
| 49.7% | 50.3% |
Figure 2: Age-specific prevalence of disability (in percentage)
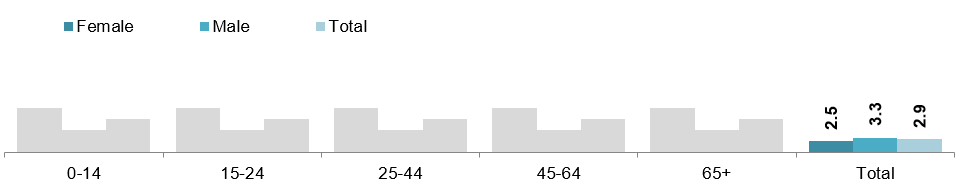
| Female | Male | Total | |
|---|---|---|---|
| Total | 2.5 | 3.3 | 2.9 |
Figure 3: Age distribution of persons with disabilities (in percentage)
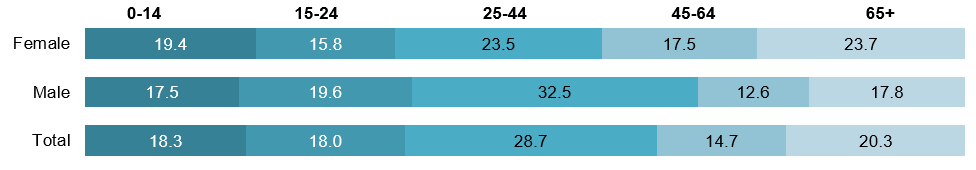
| Female | Male | Total | |
|---|---|---|---|
| 0-14 | 19.4 | 17.5 | 18.3 |
| 15-24 | 15.8 | 19.6 | 18 |
| 25-44 | 23.5 | 32.5 | 28.7 |
| 45-64 | 17.5 | 12.6 | 14.7 |
| 65+ | 23.7 | 17.8 | 20.3 |
Type of disability / difficulty (in percentage)
| Female | Male | Total | |
|---|---|---|---|
| Sight | 14.7 | 9.7 | 11.8 |
| Hearing | 14.1 | 17.9 | 16.3 |
| Understanding and communicating | 19.7 | 24.7 | 22.5 |
| Movement | 31.4 | 26.3 | 28.5 |
| Self care | 13.9 | 15.4 | 14.8 |
| Socializing with people | 48.2 | 48.4 | 48.3 |
Cause of disability / difficulty (in percentage)
| Female | Male | Total | |
|---|---|---|---|
| Congenital | 23.1 | 23.6 | 23.4 |
| Birth-related conditions | 13 | 10.1 | 11.4 |
| Epidemic disease | 2.6 | 3.1 | 2.9 |
| Other disease | 19.9 | 14.4 | 16.7 |
| Physical / psychological abuse | 0.8 | 1.7 | 1.3 |
| 13.9 | 6.8 | 9.8 | |
| Injury / accident | 15.4 | 29.5 | 23.5 |
| Evil eye / magic | 1.3 | 1.2 | 1.3 |
| Other | 5.4 | 5.1 | 5.2 |
| Not known | 4.6 | 4.3 | 4.4 |
Figure 4: Persons with disabilities (15 years and above) by marital status (in percentage)
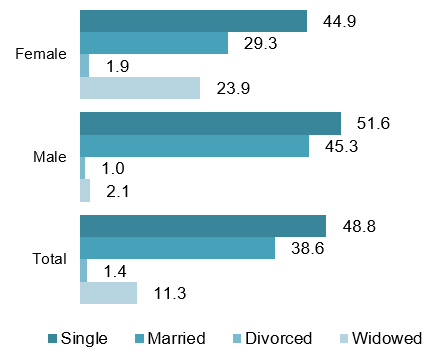
| Female | Male | Total | |
|---|---|---|---|
| Single | 44.9 | 51.6 | 48.8 |
| Married | 29.3 | 45.3 | 38.6 |
| Divorced | 1.9 | 1 | 1.4 |
| Widowed | 23.9 | 2.1 | 11.3 |
Figure 5: Total population (15 years and above) by marital status (in percentage)
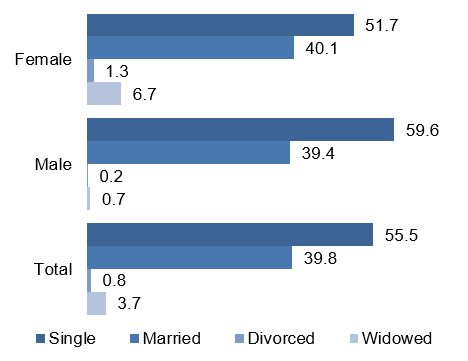
| Female | Male | Total | |
|---|---|---|---|
| Single | 51.7 | 59.6 | 55.5 |
| Married | 40.1 | 39.4 | 39.8 |
| Divorced | 1.3 | 0.2 | 0.8 |
| Total | 6.7 | 0.7 | 3.7 |
Persons with disabilities (10 years and above) by educational attainment (in percentage)
| Female | Male | Total | |
|---|---|---|---|
| Illiterate | 54.8 | 28.8 | 39.7 |
| Read / write | 17.2 | 26.7 | 22.7 |
| Basic | 11.8 | 21.8 | 17.6 |
| Secondary or equivalent | 11.6 | 16.9 | 14.7 |
| University and above | 3.9 | 5.3 | 4.7 |
| Not known / not specified | 0.6 | 0.5 | 0.5 |
Total population (10 years and above) by educational attainment (in percentage)
| Female | Male | Total | |
|---|---|---|---|
| Illiterate | 17.5 | 7 | 12.2 |
| Read / write | 21.8 | 23.3 | 22.6 |
| Basic | 22.7 | 27.6 | 25.2 |
| Secondary or equivalent | 25.1 | 28.7 | 26.9 |
| University and above | 12.8 | 13.3 | 13.1 |
| Not known / not specified | 0.1 | 0.1 | 0 |
Source: Pan Arab Project for Family Health and the National Centre for Infectious and Chronic Disease Control (2007).
| Convention | Signed | 1.5.2008 |
|---|---|---|
| Ratified / Acceded | No | |
| Optional Protocol | Signed | No |
| Ratified / Acceded | No |
Source: UN (2014).
Footnotes:
1 All data pertains to nationals only.
2 Data on the total population is not available in the source. Data on the sample size is available from the source below.
3 Persons may report more than one type of disability. For this indicator, persons are counted in each of the relevant categories. For example, persons who report two types of disability are counted twice. Therefore, the sum of the percentages exceeds 100. The percentages have been calculated as follows: Number of persons with disabilities counted in each category / total number of persons with disabilities.